tiprankstipranks
Helen Of Troy (HELE)
NASDAQ:HELE
US Market
Want to see HELE full AI Analyst Report?

Helen Of Troy (HELE) Earnings Dates, Call Summary & Reports

438 Followers

Earnings Data

Report Date
Oct 07, 2026
Before Open (Confirmed)
Period Ending
2027 (Q2)
Consensus EPS Forecast
0.51
Last Year’s EPS
0.59
Same Quarter Last Year
Based on 3 Analysts Ratings

Earnings Call Summary

Q1 2027
Earnings Call Date:Jul 08, 2026|
% Change Since:
|
Earnings Call Sentiment|Positive
The call presented a generally constructive operational and financial start to fiscal 2027: Q1 sales growth (+8.2%) and segment gains (Home & Outdoor +9.5%, Beauty & Wellness +7%) beat expectations, debt was materially reduced and inventory improved, and management is investing in a new operating model and brand initiatives. However, notable headwinds persist — gross margin compression (~110 bps), ongoing tariff and inflationary pressure, supply-chain and geopolitical risk, one-time items affecting SG&A, and near-term cadence risk (possible second-half revenue decline). On balance, the positive delivery of better-than-expected top-line performance, deleveraging and clear strategic actions outweigh the near-term margin and macro risks.
Company Guidance
Management reiterated full‑year net sales guidance of $1.759–$1.831 billion (Home & Outdoor $859–$884M; Beauty & Wellness $900–$947M), maintained adjusted EBITDA of $190–$197M (implying +2.1% to +6.3% YoY) and adjusted EPS of $3.25–$3.75, and kept full‑year free cash flow at $85–$100M while raising planned capital expenditures by $2M; Q1 results beat expectations with consolidated sales +8.2% (helped by ~$4–$5M Prime Day order phasing), Home & Outdoor +9.5%, Beauty & Wellness +7.0%, International +1.1%, but Q1 free cash flow was slightly negative. Key margin and balance‑sheet metrics: consolidated gross margin down 110 bps to 46%, SG&A ratio 31% (vs. 45.1% LY, aided by a $55M pretax gain on a facility sale), adjusted operating margin 4% (down 30 bps), inventory $467M (down $17M YoY despite ~ $15M incremental tariffs in inventory), total debt reduced by $716M and net leverage to 3.48x (from 3.87x). Guidance embeds a Phase 1 tariff refund benefit now estimated at ~$9.2M (Q1 included a $1.8M pretax benefit), notes $71M of EPA tariffs paid not in Phase 1, expects H1 sales growth low‑ to mid‑single digits and a second‑half low‑single‑digit decline, anticipates roughly 20% of annual EPS in H1 (about 15% in Q2), and warns refund timing and ongoing cost inflation (commodities, freight, CNY, supply disruption) could affect results.
Consolidated Sales Growth Outperformed Expectations
Net sales increased 8.2% year over year in Q1, coming in above company expectations; Q1 results benefited from ~$4–$5M favorable order phasing from earlier Prime Day timing.
Strong Home & Outdoor Performance
Home & Outdoor sales rose 9.5% year over year with broad-based growth across Osprey, OXO and Hydro Flask; Osprey noted as the strongest performer driven by improved international distribution and ecommerce momentum.
Beauty & Wellness Growth
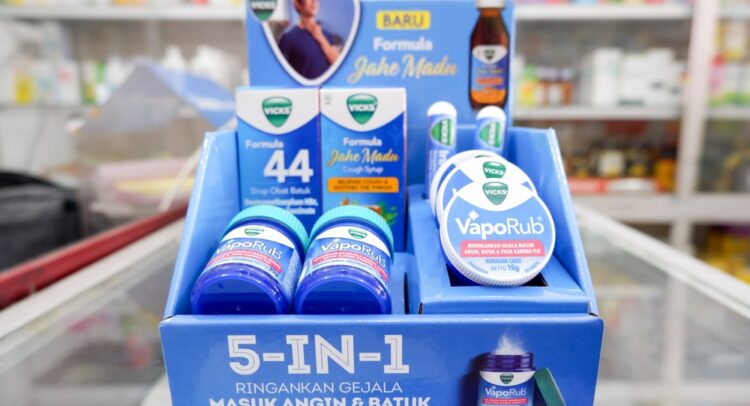
Beauty and wellness sales increased 7.0% year over year; wellness brands (Braun, Vicks, Honeywell, PUR) outperformed expectations and Olive & June led beauty growth via expanded distribution and new product collaborations.
Improved International Momentum
International sales increased 1.1% year over year, driven primarily by Osprey distribution gains and broad wellness strength.
Raised Full-Year Net Sales Outlook
Full-year net sales guidance was raised slightly to a range of $1.759B to $1.831B while maintaining adjusted EBITDA and adjusted EPS guidance.
Balance Sheet Strength and Cash Deployment
Company used proceeds from a distribution facility sale to reduce total debt by $716M; net leverage decreased to 3.48x from 3.87x the prior quarter; inventory declined to $467M (down $17M year over year despite incremental tariff costs).
Adjusted EPS and EBITDA Above Expectations (Benefit from Tariff Refunds)
Adjusted EPS and EBITDA results were ahead of expectations with a pretax Phase 1 tariff refund benefit of $1.8M recognized in Q1 and Phase 1 refunds now estimated at ~$9.2M total to be recognized when collectible.
Operational and Commercial Improvements
Company is implementing a new operating model (5 segment GMs, 3 geo-GMs), prioritizing pricing discipline, demand planning improvements, ecommerce and retail media optimization, and closer-to-consumer decision making to accelerate execution.
Product and Brand Wins
Notable product/brand highlights: Osprey Daylight and Transporter packs driving share, OXO entering pet category with new SKUs, Braun blood pressure monitors gaining share in mass retail, Olive & June collaboration with The Mandalorian driving engagement.

Helen Of Troy (HELE) Earnings, Revenues Date & History

The upcoming earnings date is based on a company’s previous reporting, and may be updated when the actual date is announced

HELE Earnings History

Report Date
Fiscal Quarter
Forecast / EPS
Last Year's EPS
EPS YoY Change
Press Release
Slides
Play Transcript
Oct 07, 2026
2027 (Q2)
0.51 / -
0.59
Jul 08, 2026
2027 (Q1)
0.02 / 0.17
0.41-58.54% (-0.24)
Apr 23, 2026
2026 (Q4)
0.70 / 0.83
2.33-64.38% (-1.50)
Nov 30, 2025
2026 (Q3)
1.70 / 1.71
2.67-35.96% (-0.96)
Oct 09, 2025
2026 (Q2)
0.53 / 0.59
1.21-51.24% (-0.62)
Jul 10, 2025
2026 (Q1)
0.79 / 0.41
0.99-58.59% (-0.58)
Apr 24, 2025
2025 (Q4)
2.38 / 2.33
2.45-4.90% (-0.12)
Jan 08, 2025
2025 (Q3)
2.62 / 2.67
2.79-4.30% (-0.12)
Oct 09, 2024
2025 (Q2)
1.05 / 1.21
1.74-30.46% (-0.53)
Jul 09, 2024
2025 (Q1)
1.59 / 0.99
1.94-48.97% (-0.95)
The table shows recent earnings report dates and whether the forecast was beat or missed. See the change in forecast and EPS from the previous year.
Beat
Missed

HELE Earnings-Related Price Changes

Report Date
Price 1 Day Before
Price 1 Day After
Percentage Change
Jul 08, 2026
$28.04$25.18-10.22%
Apr 23, 2026
$19.77$23.82+20.49%
Oct 09, 2025
$27.61$20.71-24.99%
Jul 10, 2025
$31.00$23.96-22.71%
Earnings announcements can affect a stock’s price. This table shows the stock's price the day before and the day after recent earnings reports, including the percentage change.

FAQ

When does Helen Of Troy (HELE) report earnings?
Helen Of Troy (HELE) is schdueled to report earning on Oct 07, 2026, Before Open (Confirmed).
    What is Helen Of Troy (HELE) earnings time?
    Helen Of Troy (HELE) earnings time is at Oct 07, 2026, Before Open (Confirmed).
      Where can I see when companies are reporting earnings?
      You can see which companies are reporting today on our designated earnings calendar.
        What companies are reporting earnings today?
        You can see a list of the companies which are reporting today on TipRanks earnings calendar.
          What is HELE EPS forecast?
          HELE EPS forecast for the fiscal quarter 2027 (Q2) is 0.51.

            Helen Of Troy (HELE) Earnings News

            HELE Earnings: Helen Of Troy Stock Stumbles on Q2 Results
            Premium
            Market News
            HELE Earnings: Helen Of Troy Stock Stumbles on Q2 Results
            9M ago
            HELE Soars on Q1 Beat
            Premium
            Market News
            HELE Soars on Q1 Beat
            3y ago
            Helen of Troy Stock (NASDAQ:HELE) Tanks after Disappointing FY23 Outlook
            Premium
            Market News
            Helen of Troy Stock (NASDAQ:HELE) Tanks after Disappointing FY23 Outlook
            4y ago