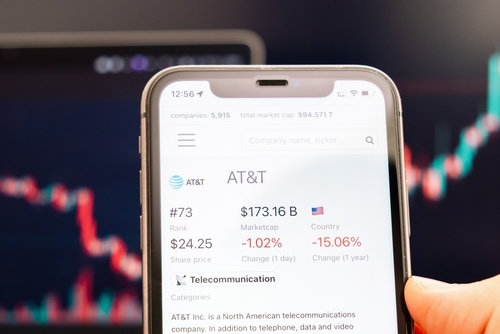
tiprankstipranks
Advertisement

FAB Holdings Information

Compare
Holdings Count
676
Total Assets
138.82M
Top 10 Percentage
5.65%
Asset Class
Equity
Category
Size And Style
Region
North America
See the full list of holdings, find out what stocks are the most undervalued and get access to the all ETF's smart score and filters.Go Premium

Top Holdings

676 Holdings as of Jun 08, 2026
Name
Weight %
Market Value
Price & Change
Market Cap
Yearly Gain
Analyst Consensus
Analyst Price Target
Smart Score
Follow
Super Micro Computer
0.83%
$1.15M
$26.46B
2.02%
3 Buy
9 Hold
2 Sell
Hold
Humana
0.71%
$980.01K
$42.74B
52.73%
6 Buy
11 Hold
2 Sell
Hold
Elevance Health, Inc.
0.62%
$852.19K
$90.81B
7.32%
14 Buy
5 Hold
0 Sell
Moderate Buy
Hewlett Packard Enterprise
0.53%
$730.10K
$66.04B
172.36%
10 Buy
7 Hold
0 Sell
Moderate Buy
Nucor
0.52%
$715.35K
$57.71B
106.81%
7 Buy
2 Hold
0 Sell
Strong Buy
Delta Air Lines Inc.
0.51%
$701.93K
$51.38B
52.75%
15 Buy
0 Hold
0 Sell
Strong Buy
T. Rowe Price Group
0.50%
$697.97K
$22.59B
11.02%
0 Buy
6 Hold
4 Sell
Moderate Sell
United Airlines Holdings, Inc.
0.49%
$682.47K
$34.18B
26.18%
15 Buy
0 Hold
0 Sell
Strong Buy
General Motors Company
0.48%
$670.91K
$75.53B
74.78%
14 Buy
3 Hold
1 Sell
Moderate Buy
Cigna
0.47%
$647.86K
$76.61B
-7.00%
14 Buy
3 Hold
0 Sell
Strong Buy
Rows:
10

Sector Breakdown

23.31%Financial13.50%Consumer Cyclical9.98%Industrials9.40%Energy8.65%Real Estate7.79%Technology7.37%Healthcare6.98%Utilities5.62%Consumer Defensive3.66%Basic Materials3.28%Communication Services0.46%General23.31%Financial
Financial
23.31%
Consumer Cyclical
13.50%
Industrials
9.98%
Energy
9.40%
Real Estate
8.65%
Technology
7.79%
Healthcare
7.37%
Utilities
6.98%
Consumer Defensive
5.62%
Basic Materials
3.66%
Communication Services
3.28%
General
0.46%

Countries Breakdown

100.00%United States100.00%United States
United States
100.00%

Breakdown By Smart Score

6.72%Outperform1011.47%Outperform910.85%Outperform816.17%Neutral719.48%Neutral610.43%Neutral511.51%Neutral45.87%Underperform35.29%Underperform22.21%Underperform16
The weighted average smart score of the FAB ETF is 6
10
6.72%
9
11.47%
8
10.85%
7
16.17%
6
19.48%
5
10.43%
4
11.51%
3
5.87%
2
5.29%
1
2.21%

FAB ETF News

FAB ETF FAQ

What are ETF FAB’s top 3 holdings?
FAB’s top 3 holdings are SMCI, HUM, ELV.
    What is ETF FAB’s holdings count?
    ETF FAB’s is holdings 676 different assets.
      What are the total assets of ETF FAB?
      ETF FAB’s total assets are 138.82M.
        What am I Missing?
        Make informed decisions based on Top Analysts' activity
        Know what industry insiders are buying
        Get actionable alerts from top Wall Street Analysts
        Find out before anyone else which stock is going to shoot up
        Get powerful stock screeners & detailed portfolio analysis
        Advertisement