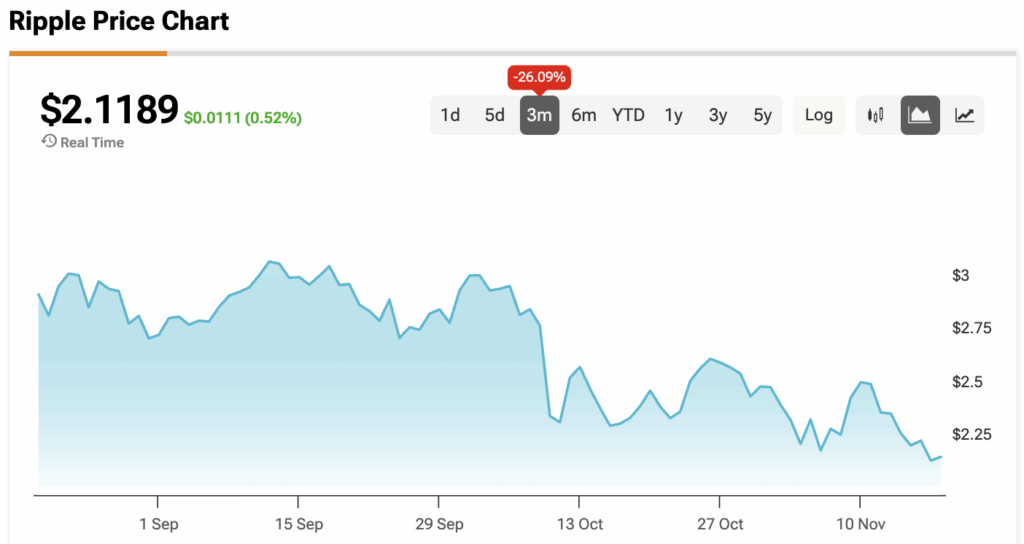
XRP (XRP-USD) slipped another 11% over the past week, and the market is now treating the drop as more than a normal cooldown. A series of technical signals, plus fading activity on the XRP Ledger, is building a case that XRP could be heading toward $1.55 unless buyers step in fast.
Claim 30% Off TipRanks
- Unlock hedge fund-level data and powerful investing tools for smarter, sharper decisions
- Discover top-performing stock ideas and upgrade to a portfolio of market leaders with Smart Investor Picks
The move mirrors a broader loss of confidence across late-cycle altcoins, but XRP’s setup is uniquely fragile. Several key support levels have already snapped, and the next line below sits much lower than most holders expect.
XRP Confirms Descending Triangle Breakdown
XRP’s eight-hour chart just validated a bearish descending triangle, which is a pattern that often signals continuation lower. The structure formed after XRP lost the $3 psychological zone in October, with lower highs pushing into a flat support near $2.20.
This support finally cracked on Monday. The breakdown sets up a measured move toward $1.55, which is about 25% below today’s price, based on the height of the triangle. Bulls have been trying to defend the $2.00 level, but losing it would open the trapdoor straight into the target zone.
Another challenge looms overhead. Glassnode data shows a heavy cluster of supply between $2.38 to $2.40, where around 3.23 billion XRP were accumulated. That band overlaps the 100-day SMA and the triangle’s resistance line, creating a ceiling that will be difficult to reclaim in the short term.
XRP Shows a Bearish Divergence on Weekly Momentum
Momentum is also working against the bulls. XRP’s weekly chart shows a clear bearish divergence: the price reached higher highs between November 2024 and July 2025, while the weekly RSI slid from 92 to 68. This kind of divergence usually signals buyer exhaustion.
Today, the RSI sits near 39 and still points lower, meaning downside momentum remains intact. Add resistance from the 50-week SMA at $2.32, and the path of least resistance continues to slope down.
XRP Ledger Activity Falls Sharply
The fundamentals are not offering much relief either. Daily active addresses on the XRP Ledger are down to roughly 44,000, which is a steep drop from the June peak near 577,000. New addresses have slid just as hard, falling from 13,500 on Nov. 10 to around 4,000 today.
Lower on-chain activity typically means reduced liquidity, fewer transactions, and fading buyer interest. Historically, similar drops in engagement have lined up with soft or declining price action.
At the moment, the charts appear to be calling the shots, and they’re pointing at $1.55 unless sentiment or volume improves fast.
At the time of writing, XRP is sitting at $2.1189.