
Education
About Us
Working with TipRanks
Follow Us


SSGAF ETF Price & Analysis
SSGAF ETF Chart & Stats
$115.56
--
Market closed
$115.56
--
Day’s Range― - ―
52-Week Range$79.09 - $115.56
Previous Close$115.56
VolumeN/A
Average Volume (3M)1.42K
AUM1.53B
NAV116.69
Expense Ratio0.55%
Holdings Count832
Beta0.07
Inception DateMay 13, 2011
Next Dividend Ex-DateN/A
Dividend Yield
(―)Shares OutstandingN/A
Standard DeviationN/A
10 Day Avg. Volume10
30 Day Avg. Volume1,417
AlphaN/A
ETF Overview
SPDR MSCI EM Asia UCITS ETF
The SPDR MSCI EM Asia UCITS ETF, trading under the ticker SSGAF, offers investors a strategic gateway into the dynamic and fast-evolving markets of Emerging Asia. As a Size and Style fund with a focus on the Total Market, this ETF provides comprehensive exposure across a broad-based niche, encapsulating the diverse economic landscape of Asia's emerging economies. By replicating the MSCI EM Asia Index, SSGAF captures a wide array of companies, from large-cap powerhouses to innovative small-cap enterprises, ensuring a balanced investment approach that aligns with regional growth trends. This fund is meticulously designed for those looking to diversify their portfolio with a strategic emphasis on Asia's burgeoning markets, promising potential growth driven by urbanization, technological advancement, and increasing consumer demand. Whether you're seeking to capitalize on the robust performance of established market leaders or the promising ascent of burgeoning start-ups, the SPDR MSCI EM Asia UCITS ETF offers a well-rounded investment solution tailored to capture the full spectrum of opportunities within Asia's emerging economies.
SPDR MSCI EM Asia UCITS ETF (SSGAF) Fund Flow Chart
SPDR MSCI EM Asia UCITS ETF (SSGAF) 1 year Net Flows: $172M
SSGAF ETF News


SSGAF ETF FAQ
What was SSGAF’s price range in the past 12 months?
SSGAF lowest ETF price was $79.09 and its highest was $115.56 in the past 12 months.
What is the AUM of SSGAF?
As of Mar 02, 2026 The AUM of SSGAF is 1.53B.
Is SSGAF overvalued?
According to Wall Street analysts SSGAF’s price is currently Undervalued.
Does SSGAF pay dividends?
SSGAF does not currently pay dividends.
How many shares outstanding does SSGAF have?
Currently, no data Available
Which hedge fund is a major shareholder of SSGAF?
Currently, no hedge funds are holding shares in SSGAF
Top 10 Holdings
Taiwan Semiconductor Manufacturing Co., Ltd.
16.52%
Samsung Electronics Co., Ltd.
7.55%
Tencent Holdings
4.49%
SK hynix Inc.
4.29%
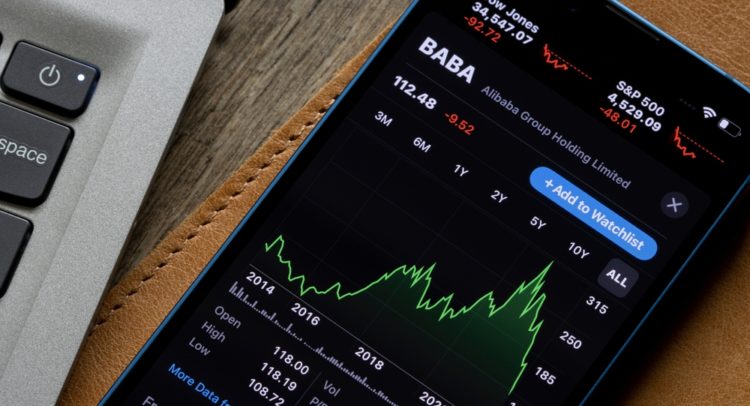
Alibaba Group Holding Ltd.
3.32%
HDFC Bank Limited
1.17%
China Construction Bank Corporation Class H
1.04%
Hon Hai Precision Industry Co., Ltd.
1.03%
MediaTek Inc
1.01%
Reliance Industries Limited
0.99%
Total41.41%
See All Holdings