XRP (XRP-USD) is currently teetering on the edge of a technical abyss, having retraced nearly 50% from its multi-year high of $3.66 to trade decisively below the psychological $2.00 barrier. The inability to hold this critical support has flipped the narrative from a “bullish breakout” to a “failed structure,” according to veteran chartist Peter Brandt. As sell-side pressure mounts, multiple indicators suggest the asset is now vulnerable to a deeper correction toward the $1.00 mark in the coming weeks.
Meet Samuel – Your Personal Investing Prophet
- Start a conversation with TipRanks’ trusted, data-backed investment intelligence
- Ask Samuel about stocks, your portfolio, or the market and get instant, personalized insights in seconds
The bearish shift is further exacerbated by a massive whale exodus; analyst Ali Martinez revealed that large holders have dumped 1.18 billion XRP over the last four weeks, creating a liquidity vacuum that bears are quickly exploiting. With trading volume declining 35%, the momentum that fueled the late-2024 rally appears to be evaporating.
Peter Brandt Forecasts a “Double Top” Liquidation Toward $1.07
The defining technical threat for XRP is a textbook “double top” pattern on the weekly chart, a classic reversal signal that looks like a letter “M”. Peter Brandt identifies the two peaks near $3.60 and the neckline at $2.00 as the primary markers of this bearish setup. “This is a potential double top,” Brandt warned, noting that a weekly close below the neckline confirms a shift from a range-pullback to a full-scale structural failure.
If the breakdown holds, the “measured move” logic projects a staggering drop. By subtracting the height of the pattern ($1.60) from the $2.00 neckline, analysts see a mathematical path toward a $0.40 to $1.07 floor. The 200-week Simple Moving Average (SMA), currently residing at $1.07, stands as the “last line of defense” before a total capitulation into the sub-dollar range.
2018 Fractal Shadows a Brutal 70% Capitulation Scenario
History is currently the bulls’ greatest enemy, as XRP’s current price structure closely mirrors the setup that sparked its 2018 bear market collapse. In 2018, the $2 region acted as a final support shelf before a plunge that eventually wiped out 70% of the asset’s value. Sellers are currently fighting to repeat this history, with the potential to drive XRP as low as $0.60 before finding any meaningful stabilization.
Elliott Wave specialist XForceGlobal attributes this bearish momentum to a “wave 3 corrective move,” which typically represents the most aggressive phase of a pullback. This wave targets the $1.20–$1.35 area, a zone that will ultimately determine if the asset can preserve its 2026 expansion phase or if it will be swallowed by a multi-year winter.
On-Chain Liquidity Nests at the $1.78 “Carnage” Floor
Despite the technical gloom, a hidden fortress of liquidity remains at $1.78. Glassnode’s URPD data shows that approximately 1.85 billion XRP were acquired at this level, making it a massive demand zone where buyers are expected to stage a final stand. Analyst Mikybull Crypto has signaled that the $1.70–$1.80 range is a “must-hold” monthly zone.
“XRP needs to hold this support line,” Mikybull warned, “Otherwise, it’ll be carnage.” If bulls can trigger a successful rebound here, the current breakdown could be invalidated as a “bear trap,” potentially reclaiming the $2.13 level and restoring the bullish outlook. However, with Standard & Poor’s-type (SPGI) sentiment turning cold, the window for a recovery is rapidly closing.
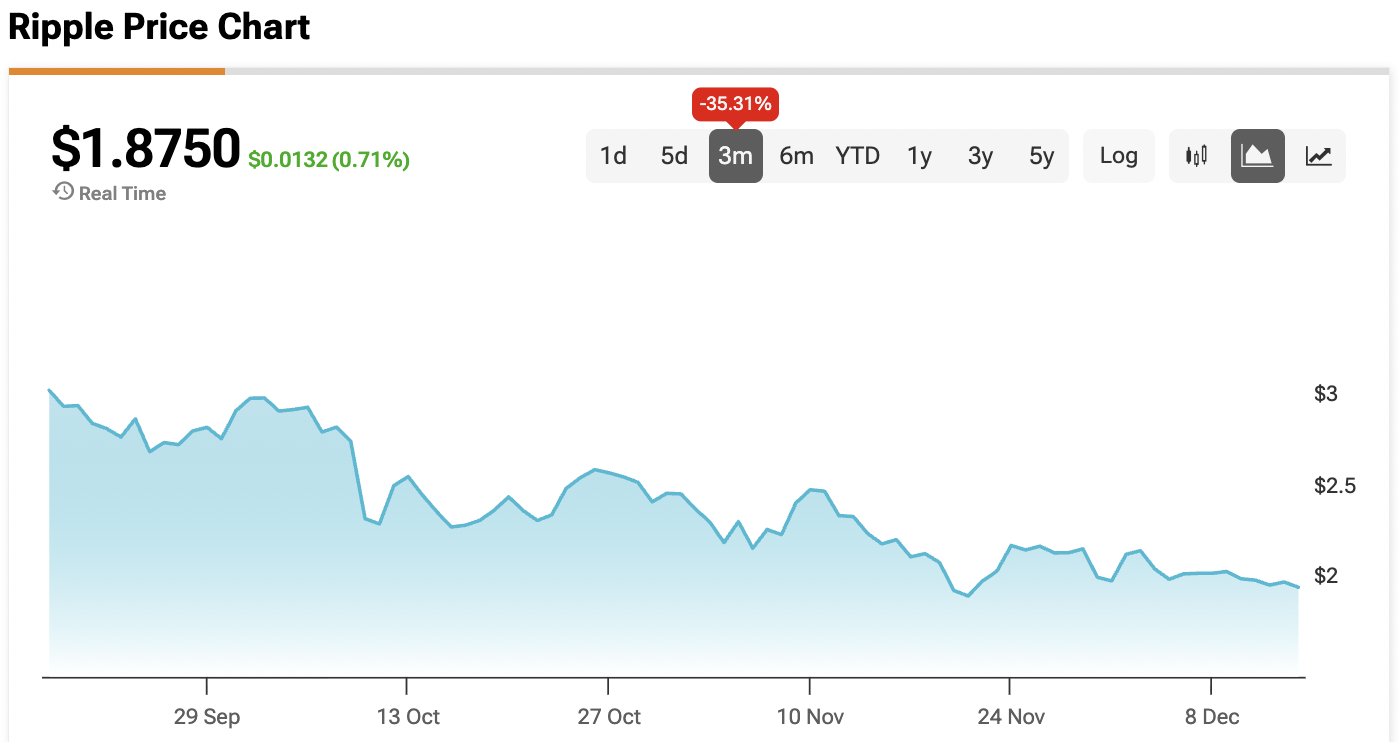
At the time of writing, XRP is sitting at $1.8750.