XRP (XRP-USD) just hit its highest price in months, tapping $3.66 and waking up one of the most polarizing communities in crypto. But this time, the rally isn’t coming from wishful thinking or recycled hopium. It’s the charts, the volume, and the analysts all pointing to the same conclusion: this rally may not be over.
Claim 30% Off TipRanks
- Unlock hedge fund-level data and powerful investing tools for smarter, sharper decisions
- Discover top-performing stock ideas and upgrade to a portfolio of market leaders with Smart Investor Picks
Over the past week, XRP has been quietly consolidating just under that local high, holding its ground as traders assess what comes next. But if the current setup holds, this could be the calm before a much bigger breakout.
XRP’s Technical Setup Flashes Bullish
On the four-hour chart, XRP is coiling inside a classic bull pennant. It’s the kind of formation that often shows up before a continuation move, especially after a sharp run-up like the one we just saw. Right now, that pennant is narrowing just above $3.45. A clean breakout above the upper trendline would trigger the next leg higher, with a textbook price target landing near $4.20.
Importantly, XRP is holding above its 50-day exponential moving average. That tells us buyers are still in control. And with the Relative Strength Index reset to a neutral zone near 50, there’s now room for another rally to build without being technically overbought.
Analysts Are Looking Even Higher
Some market analysts are already looking beyond $4.20. One of them, Mikybull Crypto, recently flagged a breakout from XRP’s prior structure and pointed to a Fibonacci extension that lands around $5.32. Under strong momentum, he says, that could stretch as high as $8.
What makes this call more convincing is the confirmed MACD crossover on the weekly chart. The last time this indicator flipped bullish, back in late 2024, XRP soared more than 450 percent. That kind of historical pattern doesn’t guarantee a repeat, but it does add weight to the bullish argument.
One Signal That Could Open the Floodgates
While price and momentum look strong, one more signal could open the door for XRP to fly even higher: market dominance. XRP’s dominance index, or XRP.D, currently sits at 5.30 percent. It’s just shy of a major resistance zone around 5.50 percent, a level that has capped XRP’s growth for more than 2,000 days.
According to analyst Dom, if XRP breaks through that threshold, it could unlock a new wave of capital rotation into the asset. In past cycles, similar breakouts have been followed by price doubling. That would bring $7, or even $10, into view.
“If history repeats, a confirmed breakout could send XRP toward $7 to $10, depending on broader market momentum,” Dom said.
What’s Fueling All This?
Part of the fuel here is regulatory clarity. Ripple recently settled its long-running case with the SEC, accepting a $50 million fine but also securing confirmation that XRP is not a security. That news alone removed one of the biggest overhangs on the asset.
At the same time, the launch of the ProShares Ultra XRP ETF has opened new doors for institutional money to enter. As a result, XRP’s market cap has now ballooned to over $210 billion, making it the third-largest cryptocurrency by size.
So, what looked like a fading altcoin earlier this year is now shaping up to be a dominant force in the current market cycle.
What TipRanks Data Tells Us About XRP
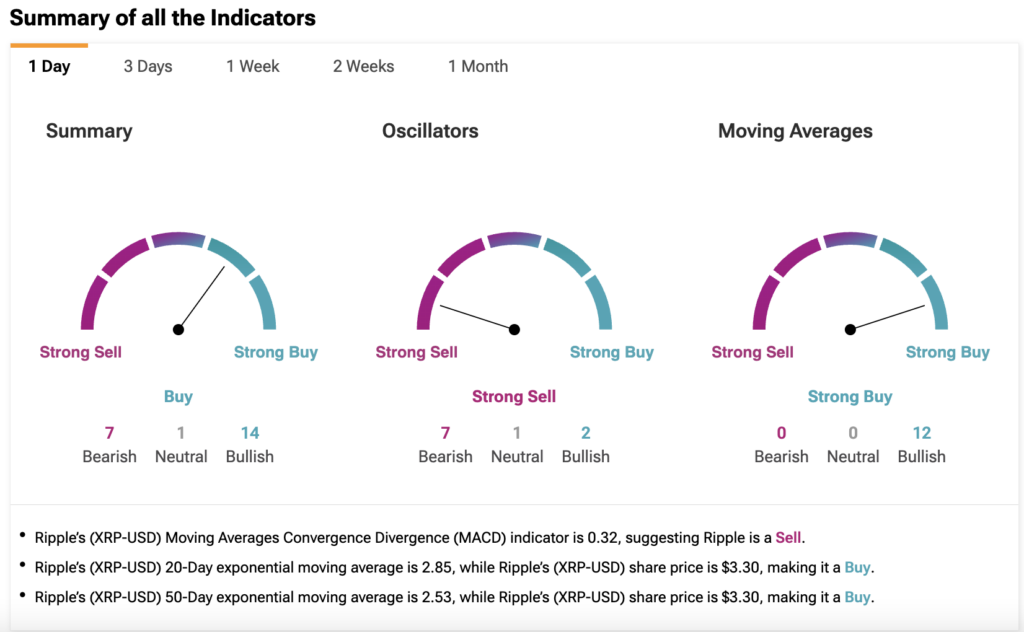
For investors looking to time their XRP entry or exit, TipRanks’ Technical Analysis tool provides a fast, visual way to gauge momentum. Based on the 1-day outlook, the tool is currently flashing a “Buy” signal. That verdict is based on a combined reading of oscillators and moving averages.
Let’s break it down.
The summary gauge shows that 14 indicators are bullish, compared to just 7 bearish and 1 neutral. This tips the scale in favor of buyers for now. The moving averages, which smooth out price action over time, show 12 bullish signals and zero bearish ones. That’s a green light for short-term traders watching trend strength.
However, the oscillator readings tell a more cautious story. Oscillators measure overbought or oversold conditions and are leaning “Strong Sell.” That means short-term traders should be aware of a possible cooldown before the next leg higher. The MACD, one of the most-watched trend indicators, sits at 0.32, which is a bearish read for the day.
Still, XRP is trading at $3.30, which is well above its 20-day and 50-day exponential moving averages of $2.85 and $2.53, respectively. That suggests momentum remains on the side of buyers, and XRP is holding above key short-term support levels.
For investors, this dashboard is a useful snapshot. Green signals on longer-term trends are supportive of more upside, but the red oscillator reads hint that short-term volatility may still pop up, especially if XRP retests its recent highs.