

While artificial intelligence represents one of the most transformative innovations of our time, the impact hasn’t been felt evenly — just look at Dell Technologies (DELL) as evidence. Although Dell represents one of the more important players in machine learning due to its specialty in AI-focused infrastructure, it just doesn’t get much love from Wall Street. Since the start of the year, DELL stock has only gained ~12%.
Meet Samuel – Your Personal Investing Prophet
- Start a conversation with TipRanks’ trusted, data-backed investment intelligence
- Ask Samuel about stocks, your portfolio, or the market and get instant, personalized insights in seconds
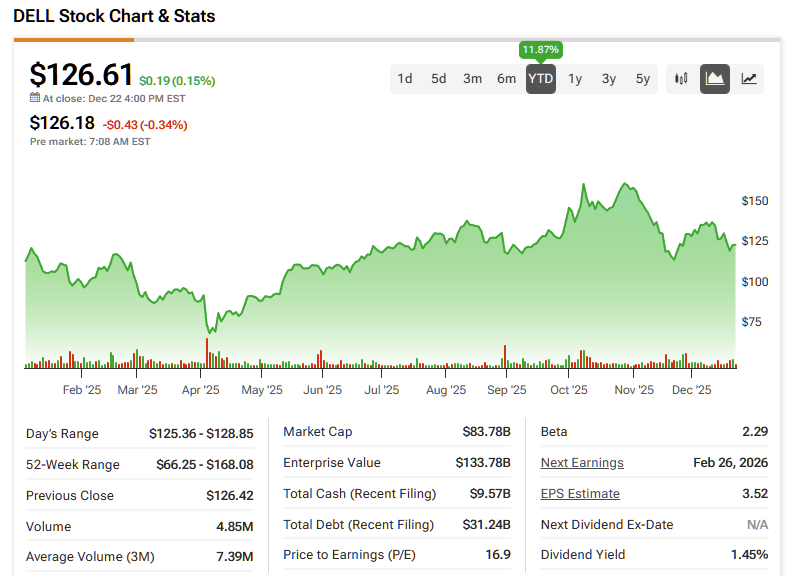
To put that into context, the benchmark S&P 500 (SPX) has gained more than 18% over the same period. The tech-centric Nasdaq Composite is up almost 21%, making DELL stock a clear laggard. Nevertheless, with the security gaining nearly 3% last Friday, there’s evidence that a sentiment turnaround could be coming.
Fundamentally, it appears that the AI bubble fears that have clouded tech stocks recently may have been digested with more nuance. Indeed, it is concerning that such a large share of market capitalization is concentrated among a few elite tech firms. At the same time, there is little evidence that the global economy is shying away from machine intelligence. If anything, the resurgence of the critical resource sector suggests that AI-related investments are rising.
With the winds seemingly blowing in the right direction, it’s time to take a look at DELL stock — especially if you’re an options trader. While the underlying company isn’t the most compelling, there may be substantial profits to be extracted here.
Narrowing Down the Expected Dispersion of DELL Stock
In past commentary, I described the options arena as a multiverse, and I continue to stand by that categorization. Quite literally, when you look at a particular options chain, you are witnessing the probabilistic pricing of alternate versions of reality. In other words, trading derivatives is about narrowing down a likely path forward in an environment laced with uncertainty.
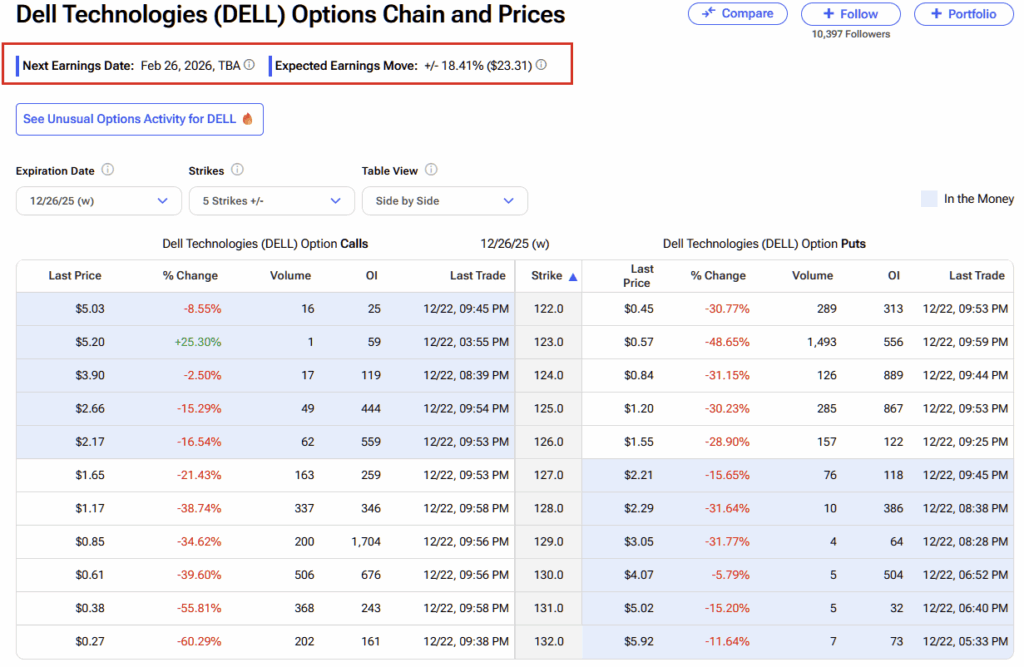
For DELL stock, TipRanks’ Expected Earnings Move indicates a projected swing of 19.12% in either direction when the underlying company releases its next earnings report on Feb. 26. This figure is calculated in part using implied volatility (IV), which is a residual measure reflecting real-time sentiment based on actual order flows.
To put it simply, IV is like the “whoosh” that you hear from a passing car relative to where you are standing. From the crack of the wind and the length of its resonance, you can infer the velocity of that vehicle at that particular point in time. While it’s helpful information, you can’t determine where the driver is specifically heading.
Furthermore, a wide dispersion indicates substantial uncertainty, which is consistent with the chaos that accompanies earnings disclosures. With DELL stock, dispersion-based analysis would be akin to guessing where a driver on the 405 freeway is ultimately heading — it’s impossible to know.
Still, that doesn’t mean we should just give up. Based on specific information, such as the time of day and the general direction the vehicle was headed, we may reasonably infer that certain end destinations are more likely to be correct than others.
To use a simple analogy, if there is a major airport where the driver was speeding toward — and if we also know that the driver typically doesn’t blow past the speed limit — then we might reasonably infer that one of the likely end destinations is the airport.
To be clear, no system can identify patterns with 100% accuracy. However, my theory is that we may use reasonable quantitative evidence to narrow down the possibilities of where DELL stock may end up.
Reshaping Our Understanding of the Market
While pattern recognition represents a key component of any analytical framework, it’s difficult to conceptualize in the equities market. That’s because we experience stocks as singular journeys across time. Similarly, we also experience our closest friends and family members as individual persons.
Nevertheless, if you’re in a relationship, you know through pattern recognition what makes your partner tick. You also know what triggers these acute behaviors. In the same vein, we can frame DELL stock in an iterative manner. This way, we can better identify its behavioral propensities.
If we took a single 10-week strand of DELL stock pricing data, the return during this period won’t tell us much about the probability of performance for the other weeks in the dataset. However, if we stacked hundreds of rolling 10-week sequences in a fixed-time distribution, the most frequent behaviors will create a bulge on the probability curve.
This bulge is what’s known as “risk geometry” — and it’s the one metric that revolutionizes options trading. With risk geometry, we not only know where DELL stock tends to move, but also where it tends to stop moving. That’s the point where even the most bullish buyers become sellers.
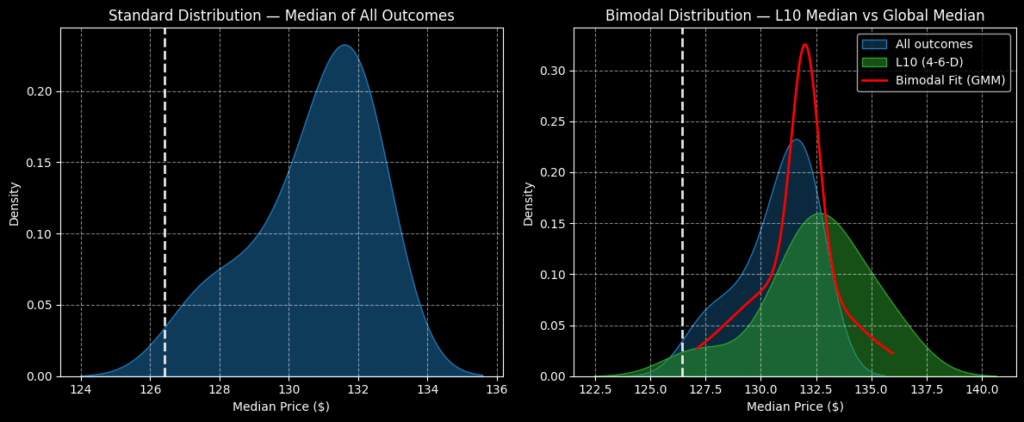
Using data from January 2019 onward, the forward 10-week distribution of DELL stock is likely to range from $124 to $136 (assuming an anchor price of $126.42, Friday’s close). Further, price clustering would likely be predominant at $131.80.
Still, we’re interested in the current quant signal, which is the 4-6-D sequence; that is, over the past 10 weeks, DELL stock recorded only four up weeks, resulting in an overall downward trend. Under this setup, the forward 10-week returns would typically range from $122.50 to $141, with price clustering at approximately $133.
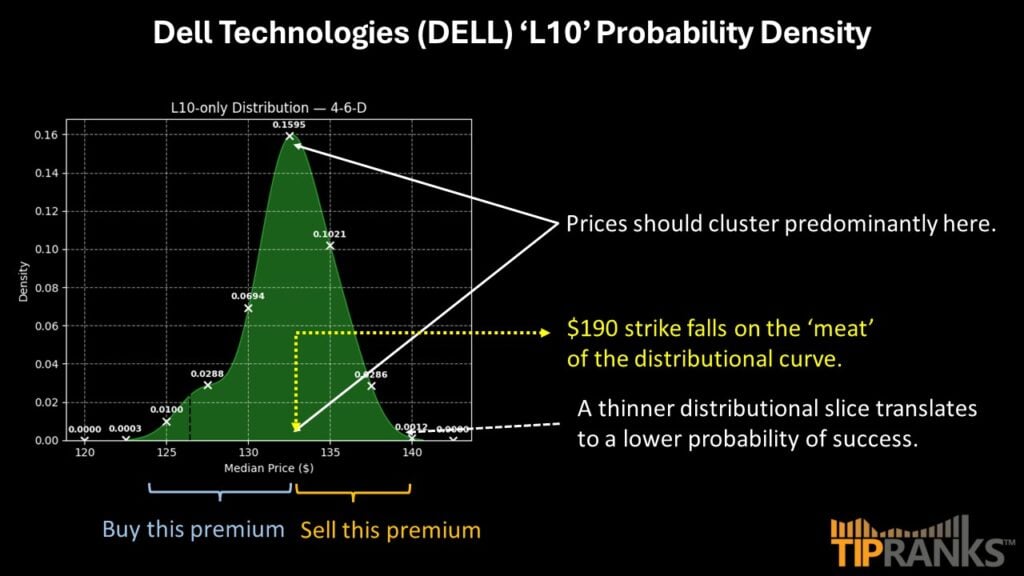
Interestingly, though, even at $135, probability density is still relatively robust. Beyond $135, probability decay accelerates sharply. Therefore, in my opinion, the 130/135 bull call spread expiring February 20, 2026, becomes a lucrative proposition.
This trade requires DELL stock to rise through the $135 strike price at expiration to trigger the maximum payout of over 127%. Breakeven occurs at $132.20, which is near the peak of the probability density. Essentially, this wager would allow you to reach for a big payout while limiting opportunity cost.
Is DELL a Buy, Sell, or Hold?
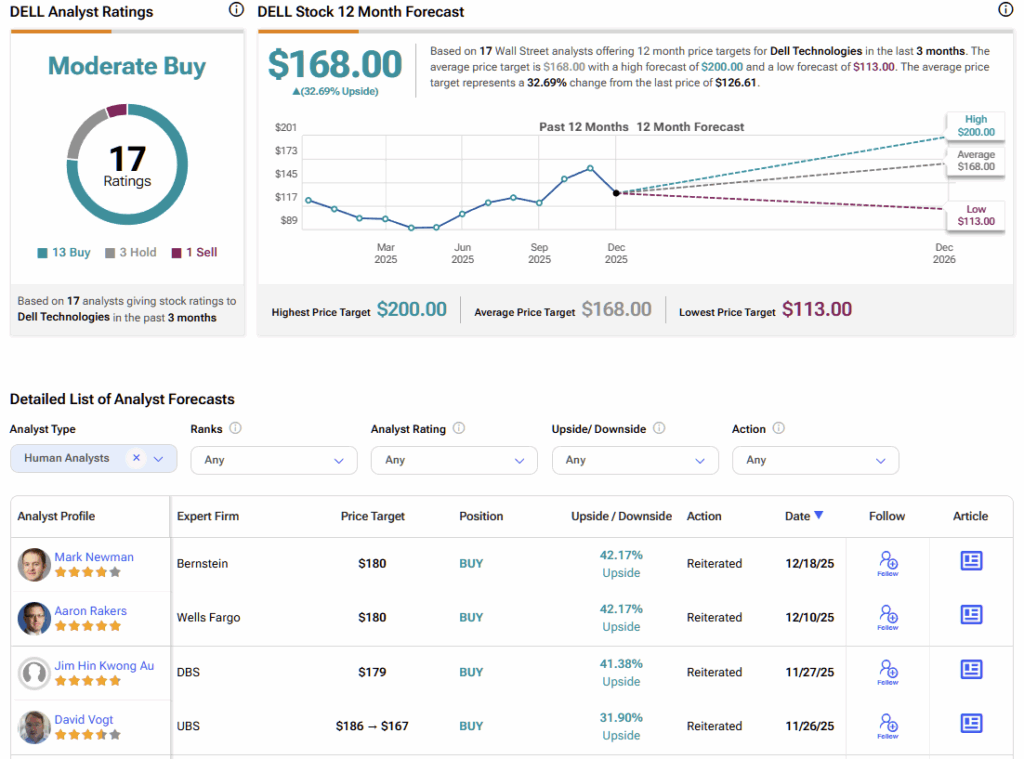
Turning to Wall Street, DELL stock has a Moderate Buy consensus rating based on 13 Buy, three Holds, and one Sell rating. The average DELL price target is $168, implying ~33% upside potential over the course of 2026.
Extracting a Probabilistic Path Forward for DELL Stock
Although Dell Technologies hasn’t generated the same level of investor excitement as many other AI-focused companies, that relative neglect may be an advantage rather than a drawback. Examining DELL’s quantitative price behavior through a fixed-time distributional framework allows us to model its likely trajectory over the next 10 weeks. Based on the data at hand, the February 20 expiration 130/135 bull call spread stands out as the most compelling setup.