

Given the severity of Oracle’s (ORCL) recent implosion, it was inevitable that several analysts and fund managers would be pounding the table on ORCL stock. Essentially, the argument is that the sell-off has gone on too far, too fast. As such, it’s an opportunity for contrarian thinkers to benefit from the coming reversion to the mean. Still, some empirical rigor is needed here.
Claim 30% Off TipRanks
- Unlock hedge fund-level data and powerful investing tools for smarter, sharper decisions
- Discover top-performing stock ideas and upgrade to a portfolio of market leaders with Smart Investor Picks

To be clear, I’m not disagreeing with the overall comeback sentiment. As many others have pointed out, Oracle missed earnings expectations for its fiscal first quarter. However, ORCL stock skyrocketed, in large part due to remaining performance obligations (RPOs) reaching $455 billion. This figure marked a 359% increase from last year, along with a $317 billion increase from Q4, driven by demand for Oracle Cloud infrastructure.
On a fundamental level, the disclosure confirmed that artificial intelligence still had a long runway for the leading tech enterprises. However, AI bubble fears have begun to affect investors’ appetite for risk-on trades. Mainly, while experts have been quick to point to the true growth potential of machine intelligence, the top entities have arguably become fattened with excessive premiums.
Unfortunately for recent stakeholders, Oracle was one of the more conspicuous victims. In the trailing month, ORCL stock lost about 30%. Despite the ugliness, it’s fair to say that Oracle is one of the powerhouses in enterprise-level software and infrastructure. As such, the red ink could be a discount — but there’s a quantitative way to capitalize on ORCL’s misfortunes.
Tapping the Discount Without Taking it for Granted
In an evangelical broadcast, Todd Friel once challenged the late atheist author Christopher Hitchens as to whether an all-powerful deity had rights over its creation. In a classic rebuttal, Hitchens declared that such rights must be demonstrated to be legitimate — it cannot simply be assumed. Interestingly, though, when the very same concept is applied to stocks, retail investors tend to accept such assumptions without thinking.
In my research on ORCL stock, I came across an article in which the author’s central premise was that, with ORCL trading at 37.8x forward earnings, the stock is far from cheap. However, if Oracle executes on its AI and cloud initiatives, scales margins, and converts backlogs, then it can justify or grow into its valuation.

However, I have two big problems with this line of thinking. First, in finance, valuation frameworks are based on future cash flows. So, if the argument is that ORCL stock is likely to rise in the future, then the current pricing shouldn’t be construed as expensive.
Consider the opposite scenario: if a stock is “cheap” but will be cheaper later, would it still be cheap today? No, it’s expensive because under this model, the stock will eventually fall in value.
Of course, the bigger issue is the author’s assumption that ORCL stock is not cheap. Since valuation is not a universal truth claim but is relative, the context to make such a statement must be provided. As is typical in stock analysis, the claim of a rich premium was asserted rather than demonstrated.
Essentially, stock analysts can only make caveated assertions because fundamental analysis, like technical analysis, plots a performance metric as a function of time. Since time never changes, practitioners are merely looking at past events—and then constructing a forward narrative devoid of empirical or statistical correlations.
Instead of engaging in income statement speculation, I propose a means of identifying when stocks will “cluster” under specific conditions. To find out, I am using a Kolmogorov-Markov framework layered with kernel density estimations (KM-KDE) with two key process distinctions: a) treat price action as recurring trials and b) plot probability density as a function of price.
This approach is powerful because we’re defining asymmetrical valuation opportunities on the variance between expected and contextually realistic outcomes. These variances are mathematically falsifiable, making them more convincing than simple rhetorical claims of undervaluation.
Moving Beyond the Classroom to the Boardroom for ORCL Stock
Using the KM-KDE approach mentioned above, the forward 10-week median returns for ORCL stock can be plotted as a distributional curve, with outcomes ranging from $195 to $215.50 (assuming Monday’s closing price of $200.28 as the anchor price). According to my proprietary model, further price clustering would likely be predominant at ~$208.50.
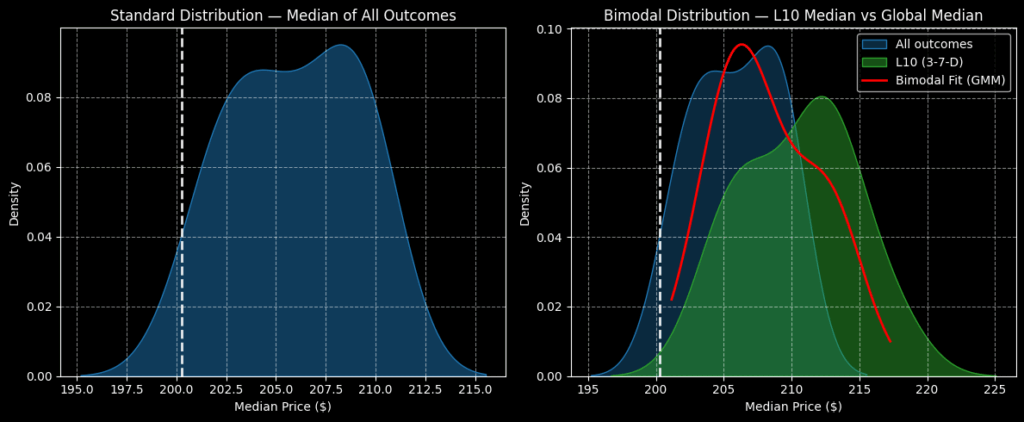
The above assessment aggregates all trials going back to January 2019. However, we’re interested in the statistical response to a specific signal, the 3-7-D formation; that is, in the trailing 10 weeks, ORCL stock printed three up weeks and seven down weeks, with an overall downward slope.
Under this condition, the forward 10-week returns would be expected to range from $197 to $225, with price clustering predominantly at $212. Essentially, there’s a 1.68% positive variance between the probability densities of baseline and conditional circumstances. While the gap isn’t vast, by leveraging the power of options, traders can potentially capitalize on this pricing inefficiency.
Based on the market intelligence above, arguably the most aggressive trade that’s still rational is the 210/220 bull call spread expiring January 16, 2026. This trade requires two simultaneous transactions occurring on a single ticket (execution): buy the $210 call and sell the $220 call, for a net debit paid of $435 (the maximum possible loss on the trade).
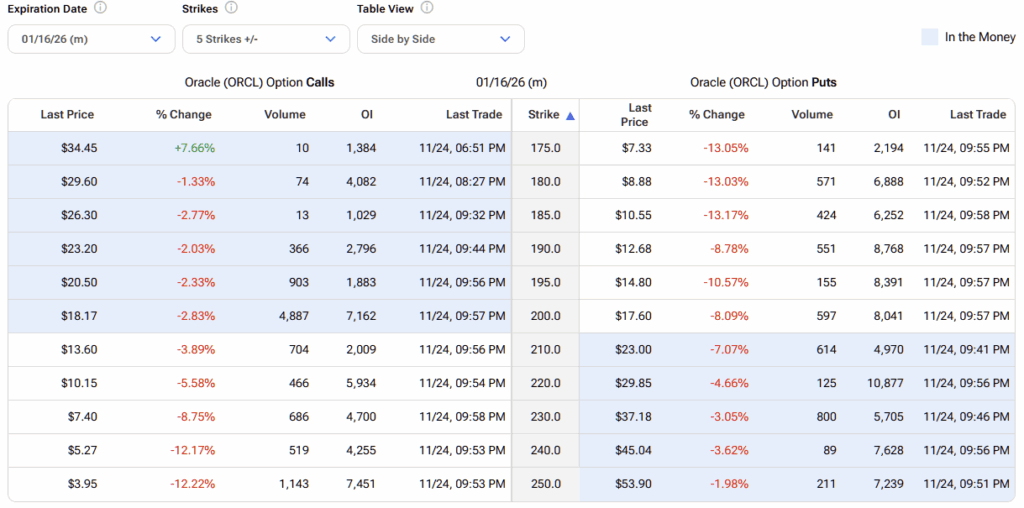
Should ORCL stock rise through the second-leg strike of $220 at expiration, the maximum profit would be $565, a payout of nearly 130%. What’s attractive here is that the breakeven price is $214.35, which is very close to the densest part of the distribution curve.
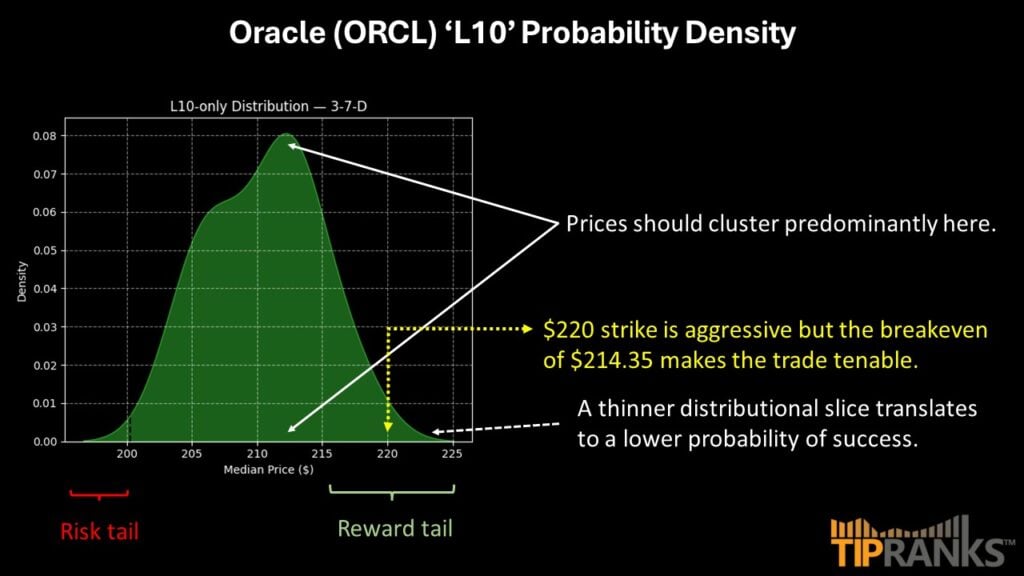
Ultimately, the point about plotting the probabilistic structure of ORCL stock is to trade according to a realistic risk-reward profile. We’re not focusing on strike prices above $225 because most outcomes would be expected to land below this point over the next 10 weeks. Instead, we’re targeting the price zones that make the most sense empirically.
Is Oracle a Buy, Hold, or Sell?
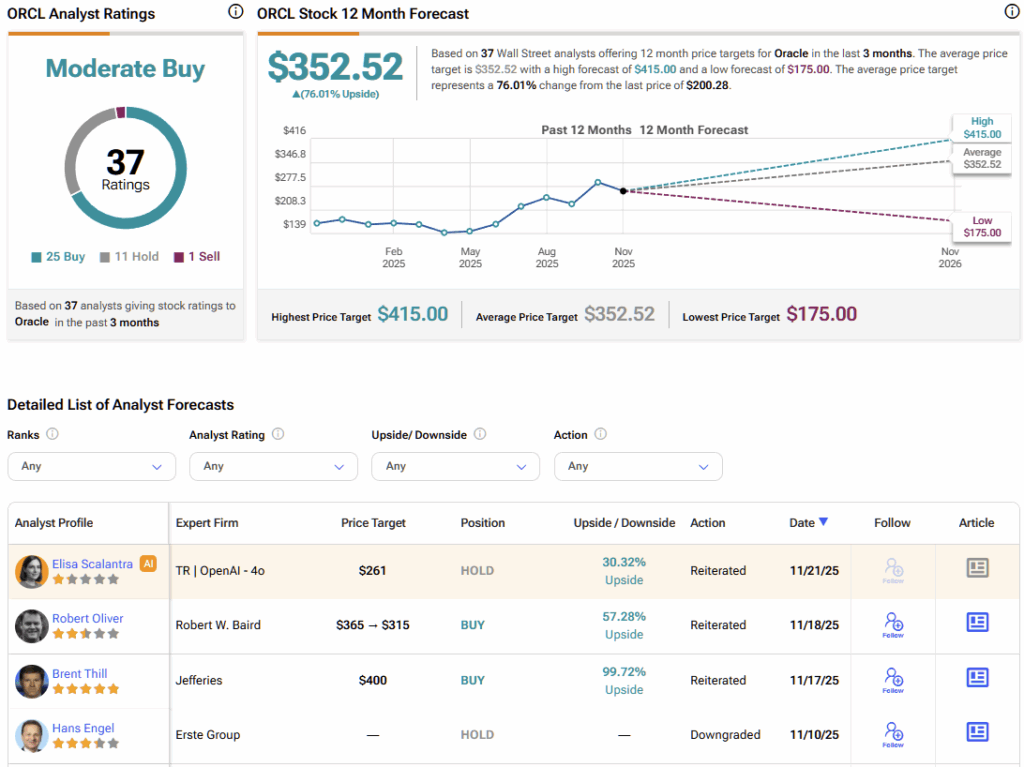
Turning to Wall Street, ORCL stock has a Moderate Buy consensus rating based on 25 Buys, 11 Holds, and one Sell rating. The average ORCL price target is $352.52, implying a staggering 76% upside potential over the coming year.
Oracle’s Slip Creates an Options Opportunity
Oracle’s recent stumble has prompted several financial commentators to label ORCL stock a “discount,” a claim that sounds appealing but requires more than a sharp price drop to be credible. A lower share price alone doesn’t automatically create value; the underlying fundamentals and expected outcomes must justify the label.
Using a quantitative lens, the picture becomes clearer. Current pricing dynamics reveal a favorable variance between expected outcomes and the market’s implied assumptions. That gap suggests the stock may be mispriced in a way disciplined investors can potentially exploit.
This environment sets the stage for a strategic bull call spread—a defined-risk, cost-efficient options structure that allows traders to position for upside while minimizing capital outlay. When paired with the positive expectancy revealed in the data, this approach offers a calculated way to capitalize on Oracle’s recent weakness rather than simply hoping the stock “bounces back.”