

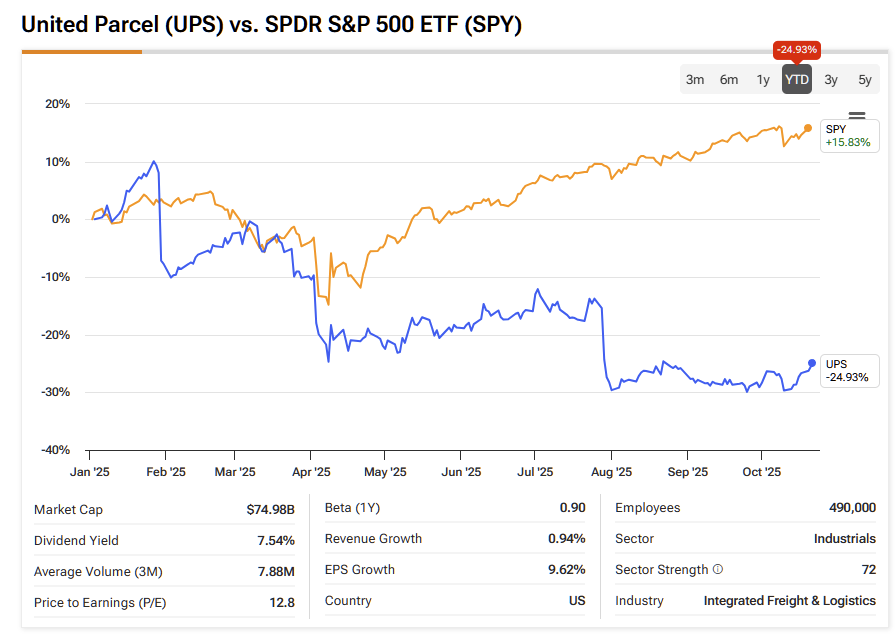
To put it diplomatically, United Parcel Service (UPS) doesn’t present a particularly compelling opportunity at the moment. Recent price action has seen the stock falling more than 26% year-to-date, while the S&P 500 has climbed over 15%. The issue extends beyond relative underperformance—UPS’s underlying fundamentals also appear unfavorable, painting a challenging picture for the logistics giant.
Claim 30% Off TipRanks
- Unlock hedge fund-level data and powerful investing tools for smarter, sharper decisions
- Discover top-performing stock ideas and upgrade to a portfolio of market leaders with Smart Investor Picks
Blame the economy, stubborn inflation, or the Trump administration’s approach to these challenges—whatever the cause, UPS stock isn’t operating in favorable fundamental conditions. It’s no surprise, then, that Wall Street analysts remain cautious. With expert sentiment nearly split down the middle, the stock could move higher—or lower.
Not exactly a bold call, right? Unfortunately, that’s the state of much public-facing financial analysis today. Fortunately, there’s an alternative to conventional fundamental and technical approaches: quantitative analysis.
Quantitative methods rely on mathematical, statistical, and computational modeling to uncover empirical relationships within data—translating uncertainty into probabilities, not opinions. While no system can perfectly forecast the future, quant analysis tends to offer a more objective and reliable framework, particularly in options trading.
From a quantitative perspective, UPS stock has just flashed a potential reversal signal. Given that such an upside move runs counter to prevailing economic expectations, the potential reward could be substantial.
Understanding the Non-Contingent Element Undergirding the Quant Framework
Invariably, all assertions about the unknown future are necessarily contingent because the projected outcome (Q) depends on a set of assumed premises or models (P). However, in fundamental analysis (FA) and technical analysis (TA), the P is belief-dependent (i.e., if earnings rise, the stock is considered undervalued, or if the stock holds support, the price is expected to rise).
In quantitative analysis (QA), the empirical P itself is non-contingent (the signal did in fact exist ontologically). Based on this signal, the quant observes forward outcomes as probabilistic distributions. Further, by layering the signal’s distributive curve against the security’s standard distribution — that is, the distribution of all outcomes and not just of the particular signal — the analyst can identify variances.
This variance mentioned above forms a bimodal distribution when juxtaposed with the standard distribution of the total aggregate data. If the quant signal’s probabilistic distribution of projected outcomes clusters more favorably than expected, there could be a mispricing in the underlying options market, which the speculative trader can capitalize on.

While explaining the nuances of data science is well beyond the scope of this article, it’s helpful to consider an analogous example from marine ecology. For scientists to study great white sharks, they must tag them to understand their behavioral and migratory patterns. As it turns out, it’s the same principle with market analysis.
Essentially, traders can tag specific quant signals and, through past analogs, determine how the market responded to them. In this manner, it’s possible to map out a probabilistic range of outcomes. To be clear, this approach doesn’t guarantee favorable results. However, it quantifies the risk-reward spectrum, thus enabling better decision-making.
Extracting a Specific Trading Idea for UPS Stock
Moving over from the theoretical realm into the practical, let’s look at the actual signal that UPS stock flashed. In the last 10 weeks, the security printed a 4-6-D sequence: four up weeks, six down weeks, with an overall downward trajectory. The actual sequence itself isn’t that important per se. Instead, we can tag and track this pattern temporally to determine its probabilistic distribution.
Under baseline conditions, the 10-week exceedance ratio (profitability rate relative to the starting point) is projected to reach 45.4%, using a dataset going back to January 2019. Further, most prices would cluster around $86.50 (assuming an anchor price of $86.41, Friday’s close). However, on an overall basis, more prices would be expected to land below the starting point.
In contrast, under 4-6-D conditions, the exceedance ratio is forecast to reach 58.1%. Further, more prices would cluster around $88, while the total range of outcomes would mostly land between $85 and $92.
Long story short, the 4-6-D sequence statistically raises the reward spectrum without a material increase in downside risk probabilities. Again, this doesn’t mean that there’s no risk in this trade. Simply put, the data says that you are more likely to win and, by deduction, less likely to lose.
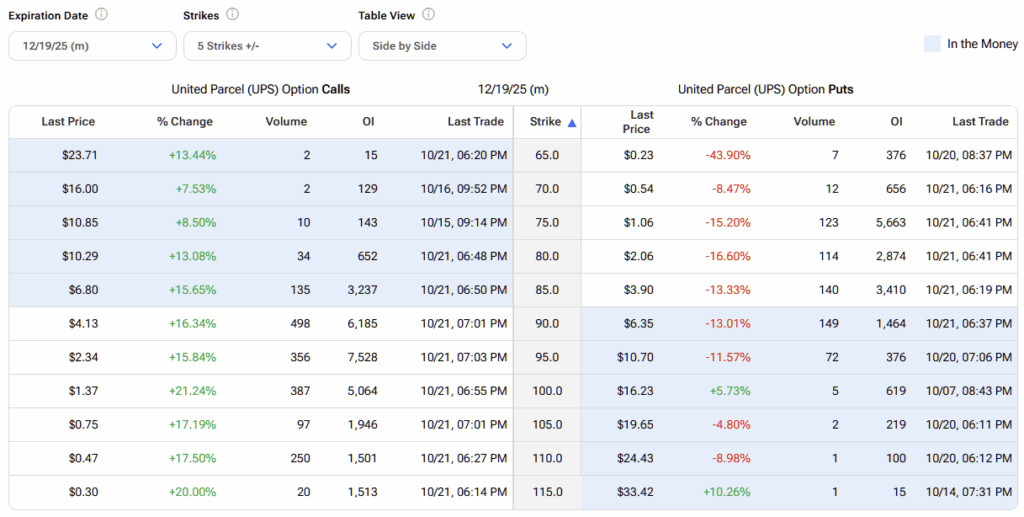
According to the quantitative data, a potential trade would be the 85/90 bull call spread expiring December 19. This trade will require UPS stock to rise through the second-leg strike of $90 at expiration to earn the maximum payout, which stands at 96%. Breakeven for this trade is $87.55.

However, the most ambitious trade would be the 90/95 bull spread, also expiring December 19. Here, the max payout stands at almost 209%. However, UPS stock must rise through the $95 strike at expiration, which is a tall order. That said, the breakeven price for the above spread is $91.62. That’s also ambitious but not unreasonable considering that share prices would be expected to cluster around $88 under 4-6-D conditions.
Is UPS a Buy, Hold, or Sell?
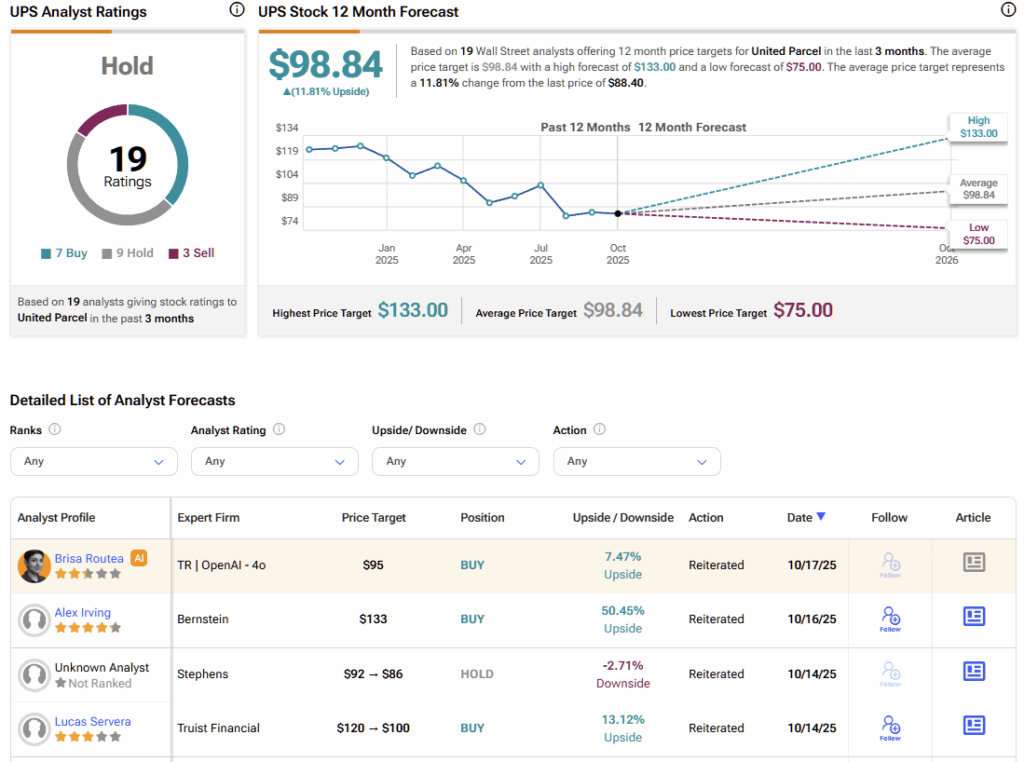
Turning to Wall Street, UPS stock carries a Hold consensus rating based on seven Buys, nine Holds, and three Sell ratings, obtained over the past three months. The average UPS price target is $98.84, implying ~11% upside potential over the coming 12 months.
Let the Data Speak Up for UPS
While fundamental and technical analyses each have their merits, their accuracy ultimately depends on the analyst behind them. In contrast, a quantitative approach lets the data do the talking — revealing a probabilistic path forward. At the moment, UPS stock is triggering a quantitative signal pointing to potential upside, highlighting two intriguing options-based plays.