

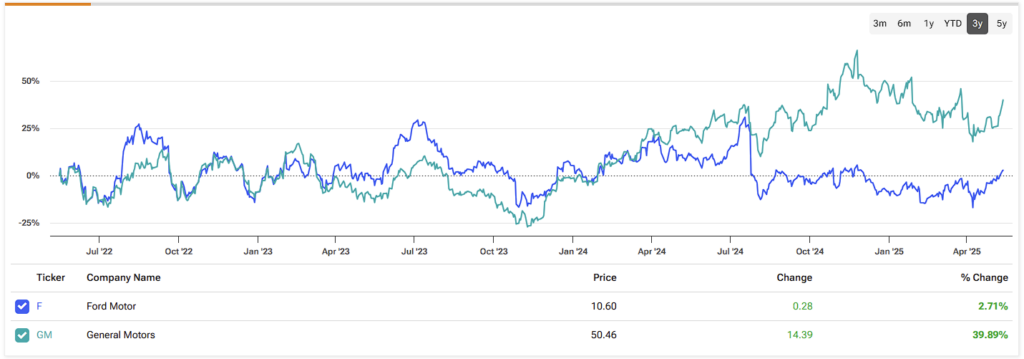
The two most prominent Detroit-based automakers, Ford Motor (F) and General Motors (GM), are exposed to the same industry trends, yet they’ve experienced notably different stock performances over the past twelve months. Ford suffered chronic losses while GM was basking in bountiful gains.
Claim 55% Off TipRanks
- Unlock hedge fund-level data and powerful investing tools for smarter, sharper decisions
- Discover top-performing stock ideas and upgrade to a portfolio of market leaders with Smart Investor Picks

The auto industry is known for its high cyclicality and capital-intensive nature, requiring companies to effectively navigate macroeconomic fluctuations. Ultimately, those consistently converting capital into earnings tend to come out on top.
To determine the better investment, this analysis examines both companies more closely from the perspectives of capital efficiency and current valuations, leading to a bullish outlook on GM and a neutral stance on Ford.
Ford vs. GM Through a Capital Allocation Lens
Several vital factors merit consideration when evaluating whether Ford or General Motors presents a more compelling valuation and stronger return on capital, particularly within the inherently cyclical automotive industry.
The automotive sector is highly capital-intensive, requiring substantial investment in manufacturing infrastructure, research and development, and distribution networks. As a result, the efficiency with which companies allocate and utilize capital is a critical measure of performance.
Consider Ford as an example. In 2024, the company reported an operating profit of $5.2 billion, largely unchanged from the $5.3 billion it earned in 2023. Over the same period, its invested capital—which includes net tangible assets and working capital—declined modestly to $60.5 billion from $63.6 billion. Based on these figures, Ford achieved a return on invested capital (ROIC) of 8.6% in 2024, consistent with the 8.5% it posted the previous year.

Taking a broader view, Ford’s performance has demonstrated notable volatility in recent years. For instance, the company reported a $4.1 billion operating loss in 2020 amid the pandemic, followed by a strong recovery, reaching $8 billion in operating profit by 2022. Over the past five years, this translates to an average return on invested capital (ROIC) of approximately 7%. Excluding the impact of 2020, that figure improves to a range of 8.5% to 13%. Nonetheless, the data reflect a pattern of inconsistency in capital returns.
In contrast, General Motors has shown more robust and stable growth. In 2024, GM reported a substantial increase in operating profit, reaching $12.7 billion, up significantly from $9.6 billion in 2023. Its invested capital also rose to $65.1 billion from $58.4 billion, driven primarily by increased working capital. Notably, reducing inventories suggests improved operational efficiency, as GM effectively converted excess stock into stronger sales and higher operating margins.

That translated into an ROI of 12.7% in 2024, up from 11.6% in 2023. And even with all the ups and downs the auto sector has faced, GM has delivered ROIs between 11.6% and 17.5% over the last five years, averaging 14.5%, even including the pandemic hit in 2020.
General Motors has demonstrated a stronger and more consistent track record in capital efficiency. Over the past five years, it has consistently delivered higher EBIT and stronger returns on invested capital compared to Ford. In contrast, Ford’s operating performance has been more volatile, with less consistent capital returns. On this metric, General Motors clearly holds the advantage.
The Contrast in Value Between Ford and GM
Capital efficiency is only part of the equation for value-oriented investors—what ultimately matters is whether the stock is attractively priced relative to the earnings it generates. This brings us to a key consideration: how do Ford and GM compare on a valuation basis?
Let’s begin with Ford. The company currently carries an enterprise value of approximately $172.7 billion and has generated around $4.38 billion in operating profit over the past twelve months. That translates to an earnings yield of just 2.5%. In other words, investors are receiving a 2.5% return on Ford’s enterprise value based on current earnings.
Compared to the 10-year U.S. Treasury yield—currently around 4.3% and widely regarded as a risk-free benchmark—Ford’s valuation appears relatively high, particularly for a cyclical business with considerable operational complexity.

It’s also important to factor in Ford’s dividend yield above 7%, which could still be a significant plus for income-focused investors. But it could also be a bit of a red flag if the stock price is down, since the dividend payout stays constant even as the price drops, making the yield look inflated on paper.
Now, on to GM—it’s sitting at a slightly lower enterprise value of $164.82 billion, but it pulled in $12.3 billion in operating profit over the same twelve-month period. That gives GM a much more compelling earnings yield of 7.4%. That’s well above the risk-free rate, and a much more attractive return for a business operating in a high-capex, cyclical industry.

Unlike Ford, General Motors offers a dividend yield of just under 1%, which might initially seem underwhelming. However, a lower dividend usually signals that GM is more cautious and disciplined with its capital. It also reduces the risk of overcommitting to payouts they might not be able to sustain during downturns, which is especially important in a highly cyclical industry like autos.
So, GM comes out ahead purely from a value perspective. It generates more operating income per dollar of enterprise value, which is exactly what investors look for when searching for undervalued opportunities.
How Wall Street Analysts Evaluate Ford and General Motors
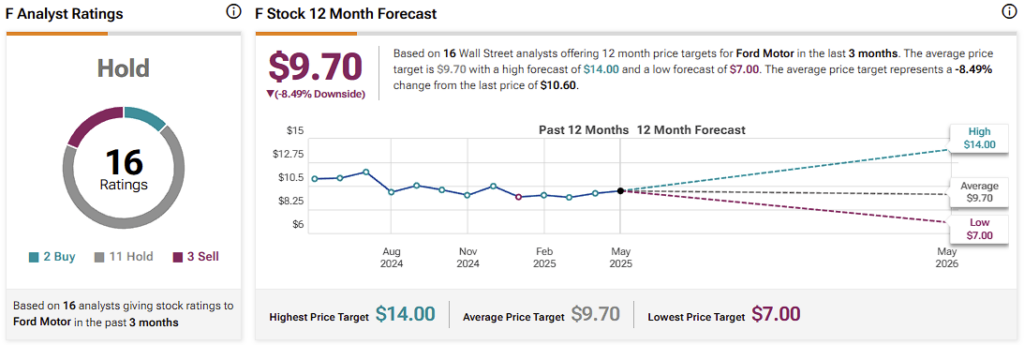
Given the points discussed so far, it’s no surprise that Ford isn’t exactly a Wall Street favorite right now. Of the 16 analysts covering the stock, only two are bullish, while 11 are neutral, and three are bearish. Ford’s average stock price target is currently $9.70, implying a 7% downside from current levels.
General Motors, on the other hand, is inducing greater positive sentiment on Wall Street. Of the 18 analysts with existing ratings on the stock, nine are bullish, seven are neutral, and two are bearish. GM stock’s average stock price target is $52.62, pointing to an upside of roughly 4%.

When the Dust Settles, GM Drives Ahead
When comparing Ford and General Motors on business fundamentals and capital efficiency—especially in the context of a cyclical industry—GM consistently shows stronger performance. From a valuation standpoint, Ford is stretched relative to its current earnings power and seems to attract investors mainly with its high dividend yield. Meanwhile, GM makes a stronger case with a higher earnings yield and better returns on invested capital—factors that tend to hold up more reliably over the long run.
Given the current market environment, General Motors presents a more attractive bullish opportunity than Ford, which appears significantly overvalued. As such, Ford warrants a neutral outlook at best.