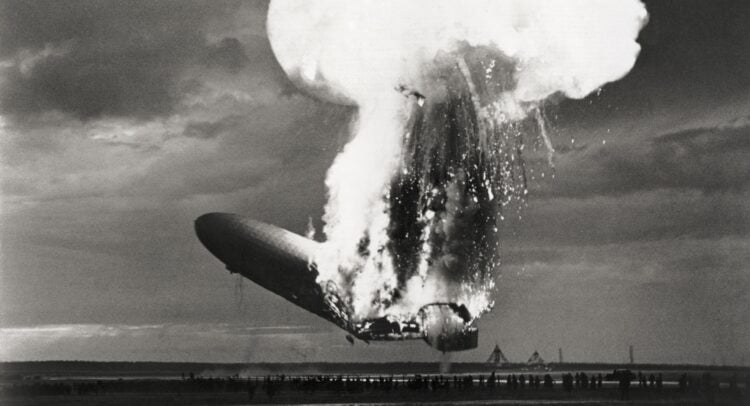
Amid concerns of an AI bubble, a technical analysis pattern named after the Hindenburg airship disaster has further spooked investors. The Hindenburg Omen, an indicator used to predict stock market crashes, was recently triggered on October 29 and 30.
Elevate Your Investing Strategy:
- Take advantage of TipRanks Premium at 50% off! Unlock powerful investing tools, advanced data, and expert analyst insights to help you invest with confidence.
The signal is activated when the percentage of new highs and new lows on the New York Stock Exchange (NYSE) exceeds 2.8% with a negative McClellan Oscillator reading and the NYSE Index higher than it was 50 days ago.
Hindenburg Omen Signals Short-Term Losses but Long-Term Gains
According to Subu Trade, the S&P 500 (SPX) is positive only 30% of the time one month after a Hindenburg Omen with an average loss of 4.09%. The six-month average return is a loss of 1.43%, while the one-year average return is a gain of 6.18%. The last signal, which occurred in September 2024, resulted in a one-month return of 4.07% and a six-month return of 1.53%.
Historically, markets have often responded negatively in the near term to the Hindenburg Omen, although the one-year return has been positive 80% of the time.
Stay ahead of macro events with our up-to-the-minute Economic Calendar — filter by impact, country, and more.


