

Easily ranking among the most agonizing options-based ideas, Uber Technologies (UBER) nevertheless presents a nuanced trading proposition. However, the nuance involves both mathematical complexity and greater tolerance for risk. An argument can be made that the potential reward—a possible triple-digit payout within the next two months—may justify the risk of incurring losses in the proposed trade.
Meet Samuel – Your Personal Investing Prophet
- Start a conversation with TipRanks’ trusted, data-backed investment intelligence
- Ask Samuel about stocks, your portfolio, or the market and get instant, personalized insights in seconds
First, the basic premise is that while the ride-sharing giant commands a strong, viable business — as evidenced by UBER stock gaining over 34% this year — it has also suffered significant volatility since early October. Much of it might be due to the security falling in sympathy with other tech players, especially as investors fled from artificial intelligence and other innovations.

Still, both academic research and our own observations indicate that the equities market is “reflexive.” Simply put, perceptions can ultimately shape reality—especially when those perceptions are reinforced by collective feedback loops.
Subsequently, the argument for UBER stock is that, although the security has lost 16% since the beginning of October, investors may view this extended period of volatility as a potential discount. Eventually, the market could rerate UBER at a valuation more befitting an enterprise of its stature.
Statistical reasoning and calculus signal a compelling bullish argument for UBER stock, best captured through stock options.
Why Trading UBER Stock is Equivalent to Standardized Testing
Trading options involves variable elimination. For example, using implied volatility (IV) and the Black-Scholes formula, the expected move for UBER stock at the January expiration date is 5.4% in either direction. That would imply a range between $76.60 and $85.34.

What’s more, Uber is scheduled to release its next earnings report on February 11. At that point, TipRanks Expected Earnings Move tool indicates a possible swing of 11.8% in either direction. If so, the expected range would be between $71.57 and $90.37.
While this information is insightful, as it stems from IV and is thus a residual construct of actual option order flows, it’s also challenging to interpret. Essentially, a $9 spread is a wide dispersion. What’s more, the Black-Scholes model assumes a market environment with lognormal returns, which is not how actual markets react.
As such, there’s no meaningful distinction in probability magnitude of the aforementioned distribution because the concept of probability itself in this model is mathematically collapsed. What I’d like to do is to “un-collapse” probability by bringing this concept to the forefront.
Narrowing Down Where UBER is Likely to Materialize
One of the main challenges of variable elimination is that the object being eliminated must exist in some mathematically definable form. Obviously, the problem with price action itself is that it’s a continuous signal. In other words, UBER stock can theoretically rise to infinity, and infinity is not a variable that can be eliminated.
Therefore, the first order of business is to convert the continuous price signal into a discrete signal. That way, a piece of price action has a beginning and an end. It’s a real object now that can be identified and classified. Next, we need to study the behavioral tendencies of these objects at scale.
If we took a single 10-week strand of UBER stock price data, the return during this period would not tell us anything about the probability of performance of the other weeks in the dataset. But what if we stacked hundreds of rolling 10-week trials on a fixed-time distribution? Under this approach, the most consistent, frequent behaviors would create bulges in probability mass.
These bulges represent risk geometry, which reveals the ascendancy of bullish sentiment among buyers. More importantly, it reveals the transition point where buyers are tempted to become sellers. In this manner, we know where to push — and where to pull back.

Using this hierarchical framework, the forward 10-week returns of UBER stock would likely range between $79 and $85.30 (assuming an anchor price of $80.97, Tuesday’s close). However, we’re interested in the response to the current quantitative signal, which is the 4-6-D sequence. In the past 10 weeks, UBER recorded only four up weeks, resulting in an overall downward trend.
Under this scenario, the forward 10-week returns don’t really change much — you’re still talking about a range between $79 and $85. However, what does change is that the probability mass stays thicker across a wider dispersion.
In sports terms, the defense is allowing you more space to roam. Therefore, you have a better chance of going deeper into enemy territory in a bid to score a goal.
Locking Down a Specific Trading Idea
Based on the above market intelligence, the one trade that stands out to me is the 80/85 bull call spread expiring Feb. 20, 2026. For this trade to be fully profitable, UBER stock needs to rise through the $85 strike price at expiration, which is an ambitious target. After all, $85 sits at the tail end of the expected distribution. However, with a positive result for its upcoming earnings report, this trade could work.
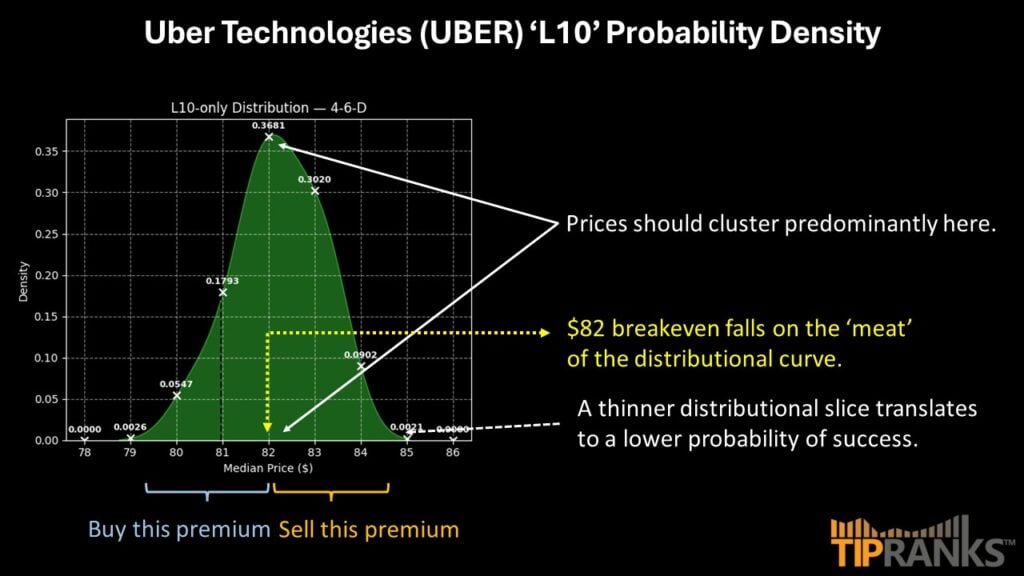
If the second-leg strike is triggered at expiration, the maximum payout is nearly 113%. Breakeven also lands at $82.35, which is really what gives this trade its wings.
Essentially, the breakeven price sits very close to peak probability density, which is around $82. Between $82 and $83, probability density declines by only 17.96% on a relative basis. Between $83 and $84, this metric falls by 70.13%.
In other words, the breakeven price of the 80/85 spread is placed right before probability decay accelerates. It effectively means that you stand a decent chance of not losing money, while still being in contention to fight for a big payout.
Is UBER a Buy, Sell, or Hold?
Turning to Wall Street, UBER stock has a Strong Buy consensus rating based on 26 Buy, three Holds, and zero Sell ratings. The average UBER price target is $116.80, implying ~43% upside potential in 2026.

Using Data Science to Plot a Way Forward for UBER Stock
While reflexivity may help turn Uber’s fortunes around, we can also use data science to better navigate the complexities of the ride-sharing giant’s options chain. Specifically, by using a hierarchical framework, we can calculate the risk geometry of UBER stock, which enables informed decisions aligned with its probabilistic profile.