

As one of the more volatile names in the market, multinational commerce specialist PDD Holdings (PDD) offers an intriguing prospect for bold speculators. On paper, circumstances don’t seem that thrilling. On a year-to-date basis, PDD stock has gained only about 19%, which is slightly better than the S&P 500’s (SPX) performance during the same period. However, specific periods have been accentuated by strong upside moves.
Meet Samuel – Your Personal Investing Prophet
- Start a conversation with TipRanks’ trusted, data-backed investment intelligence
- Ask Samuel about stocks, your portfolio, or the market and get instant, personalized insights in seconds
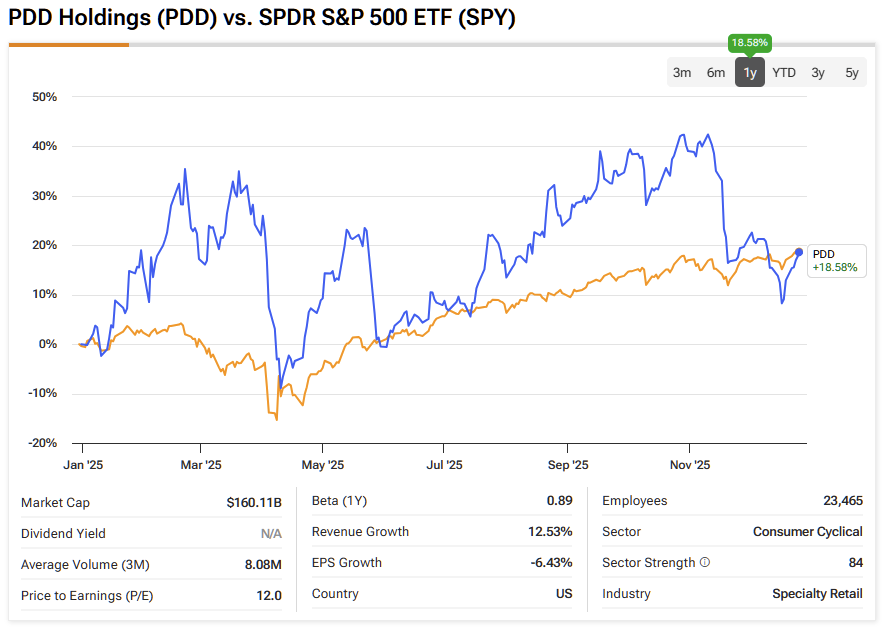
For example, in the trailing one-month period following the close of the November 10 session, PDD stock gained more than 11%. The stock also experienced a robust rally from the second half of the year through early November. Still, it must be said that PDD suffers from chronic volatility.
To use an esoteric term, the security is an example of the “non-ergodicity” of high-profile growth stocks. In other words, the actual return over a given period of time doesn’t always match the expected return, precisely because of its wild valuation swings.
At the same time, this kinetic environment can be a rich source of data for data-driven traders. By deciphering the behavioral tendencies of PDD stock, it’s possible to forecast its next moves. However, such a predictive approach requires intense analysis to uncover structural arbitrage.
It just so happens that PDD stock may be one of the most mispriced securities in the market today — and this could potentially open up an options-based strategy good for over a 440% payout. As a result, I’m staying bullish within a specific quant options setup.
Pivoting Away from Low-Value Frameworks
Over a specific period, a popular publicly traded security is expected to traverse multiple sentiment regimes and be influenced by them. In that regard, the market is analogous to an earthquake. As you know, there isn’t just one type of quake. Some just roll by, doing little more than raising your blood pressure. Others will have you praying to a deity, even if you aren’t religious.
All jokes aside, the point is that people and structures respond differently to different magnitudes of earthquakes. In the same vein, traders react differently to various market sentiment cues. However, when you consider a typical piece of fundamental, technical, or even quantitative analysis, unless the author explicitly specifies otherwise, you are left with the assumption that you’re observing one continuous sentiment regime.
Much of the problem is tied to price action itself. As a continuous signal, the share price can theoretically rise indefinitely. However, infinity is not a quantifiable category as it has no parameters. Fortunately, we can address this dilemma through a process known as “discretization.” By compressing price action into up sessions and down sessions, we can artificially create homogeneity across the dataset.
At first glance, it might sound strange to compress price into a binary language. However, the discretization process enables comparison of behavioral states over long periods of time. For instance, an up session in 2019 would fall under the same category as an up session in 2025.
Essentially, we’re taking an unbounded signal and converting it into a bounded one. Through this homogeneity, we can now conduct a hierarchical analysis to reveal priceless “risk geometry.”
Identifying the Risk-Reward Profile of PDD Stock
Behavioral patterns can only form from repeated trials, and that’s a concept that’s evident in the term itself. You can’t observe “patterns” if the data that you’re observing only happens once. At that point, this would seem to hurt the case for probabilistic analysis for PDD stock, which is merely one stock’s journey through time.
Obviously, if we took a single 10-week strand of PDD price data, the return during this period wouldn’t tell us anything about the probability of performance for the other weeks in the dataset. But what if we stacked hundreds of rolling 10-week sequences onto a fixed-time distribution? At that point, the most frequent, consistent behaviors would yield bulges in probability mass.
These bulges represent risk geometry, which in part shows the ascendancy of bullish sentiment among market buyers. More importantly, it shows the transition where buyers are tempted to become sellers. In this manner, risk geometry gives us an indication of where we can push — and where we should back off.
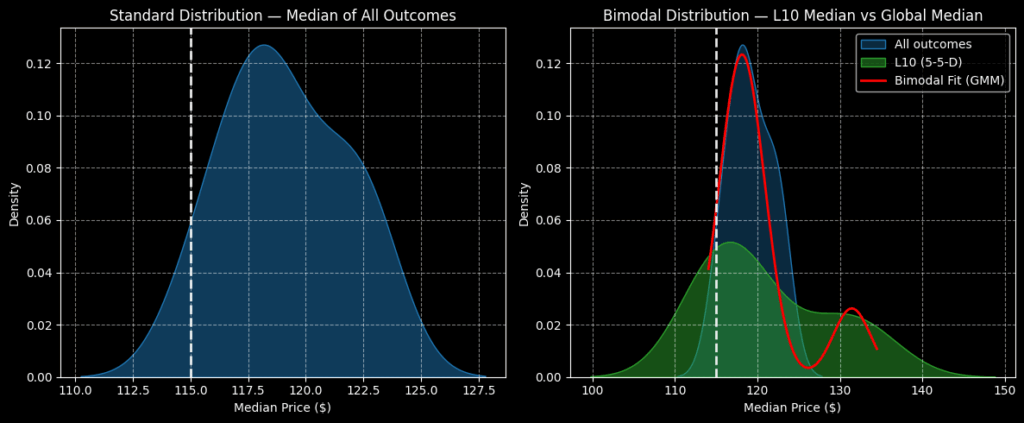
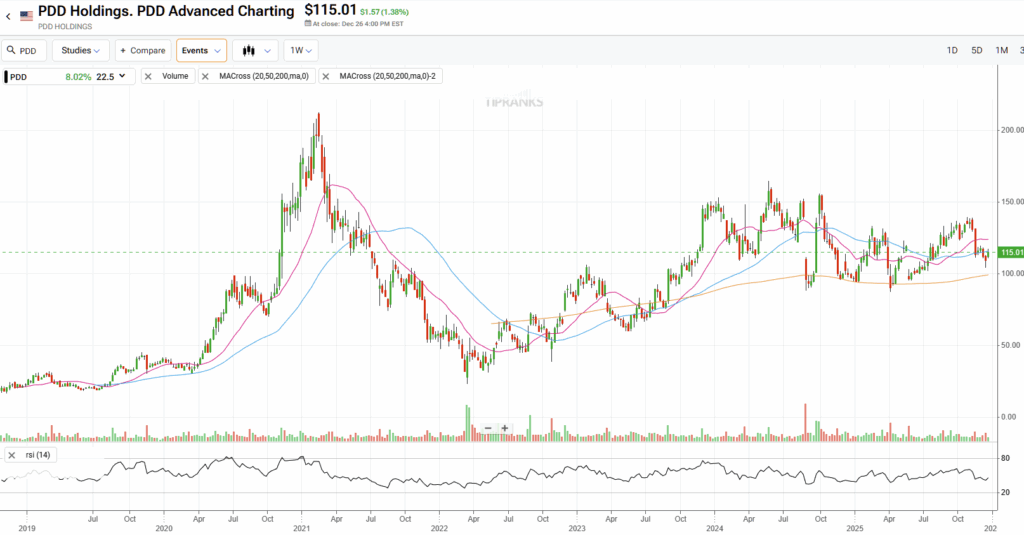
In the case of PDD stock, its forward 10-week returns would likely range between $110 and $127.50 (assuming an anchor price of $115.01). Further, the probability density would likely peak at roughly $118. However, we’re interested in the current quantitative signal, which is the 5-5-D sequence. During the past 10 weeks, the number of up and down weeks was split evenly, but with an overall downward slope.
Reflexively, however, the market tends to respond positively to this quantitative setup, with forward 10-week outcomes ranging from $100 to $150. To be fair, price clustering would likely be predominant at just shy of $120. Therefore, this latter price point does seem to be an intriguing idea for a capped-risk, capped-reward debit spread.
However, a notable secondary activity is forecasted to materialize near $130. By targeting this price point in a debit spread, speculators may realize a massive payout.
A Tempting Bull Spread on Tap
If we consider “risk topography,” a three-dimensional view of the probability space, the focus on the $130 price point becomes much clearer. Yes, there’s a lot of activity projected between $115 and $120. From a pure probability standpoint, this zone would represent a natural target. Plus, there are some options spreads that offer substantial rewards if PDD stock rises above $120 at expiration.
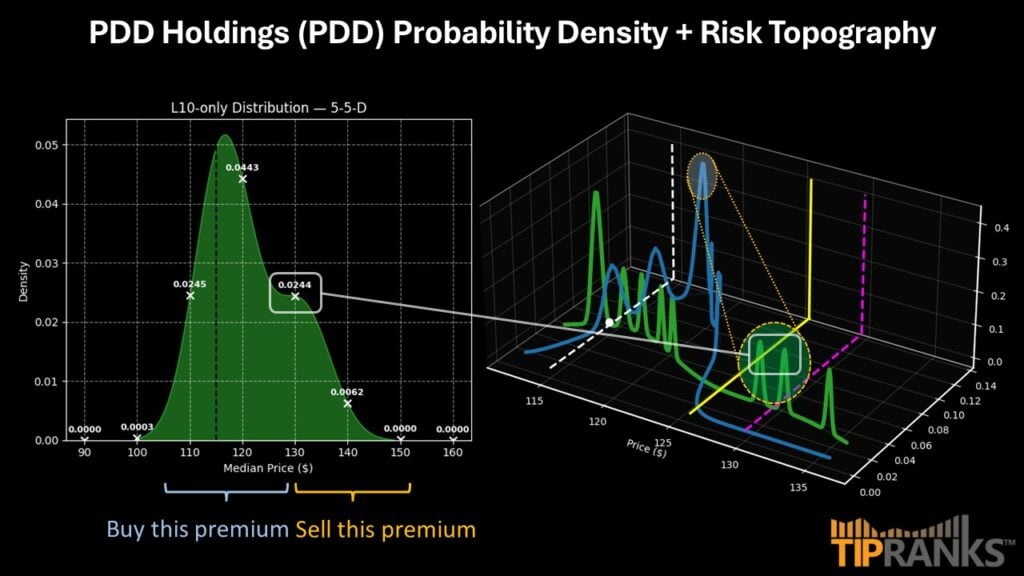
Still, it’s fair to point out that there may be activity that materializes around $130 (based on prior flashings of the 5-5-D sequence). To make a long story short, if you cap your reward at $120 and PDD stock ends up going to $130, you’ll absorb a massive opportunity cost.
Right now, the maximum payout for the 125/130 bull call spread expiring Feb. 20, 2026, stands at over 443%, a simply gargantuan reward. The $130 strike price is an ambitious target, as it would require PDD stock to appreciate by more than 13% from the current price.
Nevertheless, when I look at risk topography, I see a strong likelihood of PDD stock reaching this price point. Here, a staggered approach wouldn’t be a bad idea, where a trader is exposed to $120 but also has a position for the 125/130 spread.
Is PDD Holdings a Buy, Sell, or Hold?
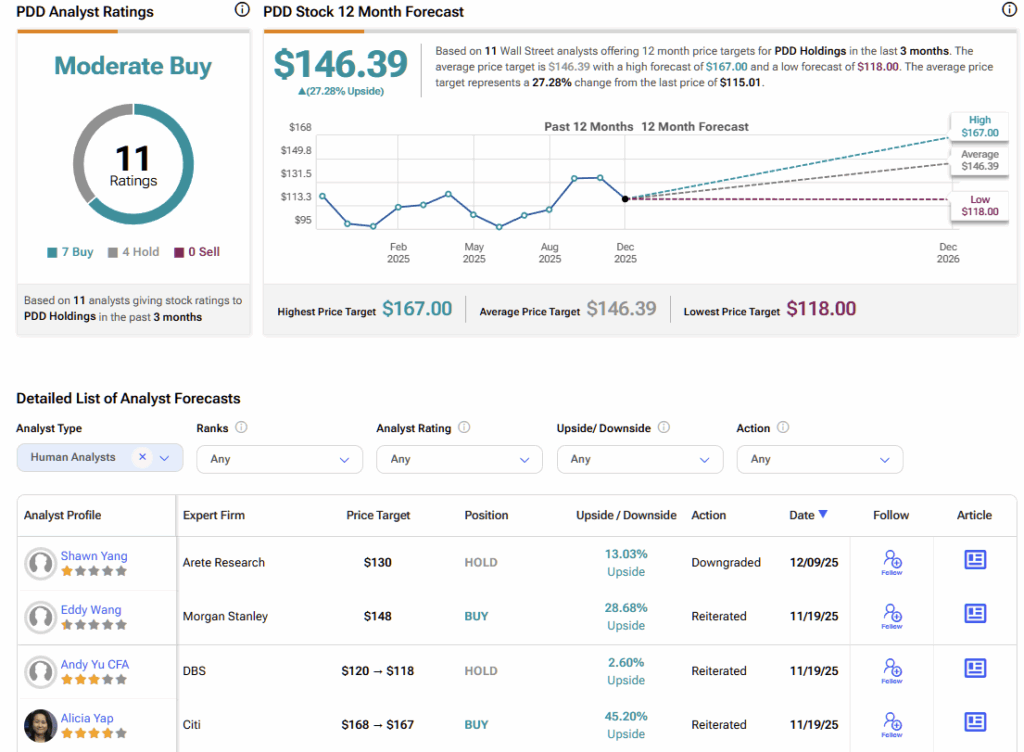
Turning to Wall Street, PDD stock carries a Moderate Buy consensus rating based on seven Buys, four Holds, and zero Sell ratings. The average PDD stock price target is $146.39, implying ~27% upside potential over the course of 2026.
A Fresh Perspective Changes Everything for PDD Stock
Typically, the offer for a payout exceeding 440% would be met with incredible skepticism — and for good reason. However, in the case of PDD stock, the argument has some semblance of credibility. When looking at behavioral trends under the current quant signal, the $130 strike price is a contextually realistic target. As such, bold speculators may want to give PDD Holdings a second look.