

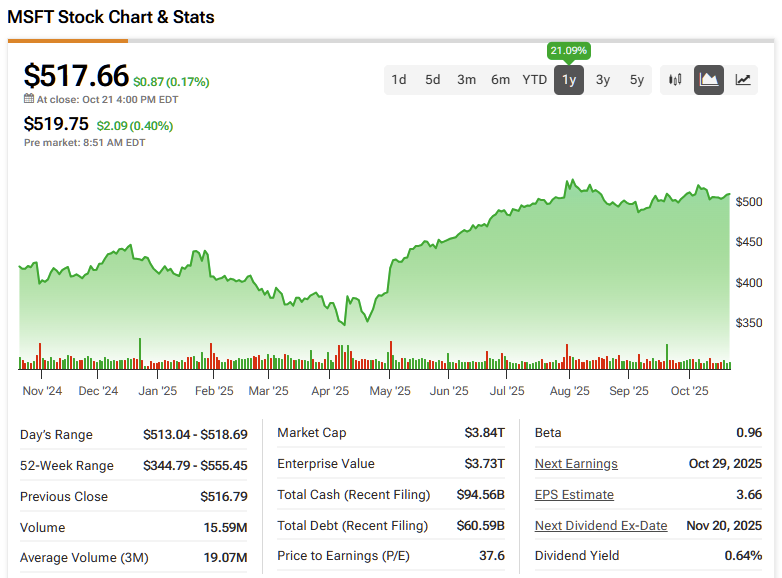
Microsoft (MSFT) continues to show a clear upward bias, with the stock maintaining a steady long-term uptrend over the past several years. The ride hasn’t been perfectly smooth, but history suggests that patience with MSFT has consistently rewarded investors over time.
Claim 30% Off TipRanks
- Unlock hedge fund-level data and powerful investing tools for smarter, sharper decisions
- Discover top-performing stock ideas and upgrade to a portfolio of market leaders with Smart Investor Picks
That said, this level of predictability comes with a trade-off—moderate upside potential. While there have been periods of outsized performance, genuine inefficiencies are hard to find. Microsoft is one of the most closely watched companies on the planet, and any new catalyst is quickly absorbed and reflected in the share price.
By extension, traditional fundamental and technical analysis offer little incremental edge to the average retail trader. Every meaningful variable—earnings guidance, product cycles, macro trends, regulatory risk—is instantly digested and modeled by thousands of institutions. It’s unrealistic to expect an individual with a laptop to uncover what the pros have missed.
To gain an edge in a stock like Microsoft, you need a methodology few others use—that’s where a quantitative approach comes in.
Getting to Grips with the Math
Quantitative analysis involves the study of empirical signals and patterns to decipher a probabilistic distribution of outcomes. Much of what distinguishes the quant approach from traditional methodologies is contingency. Unlike fundamental and technical analysis, where both the premise and conclusion are contingent on the person making the claim (and are by necessity biased), quant analysis involves a non-contingent empirical observation.
In other words, the signal that lights up a quant trader’s radar isn’t interpretive, like a head-and-shoulders pattern. It is an actual, verifiable signal observable to anyone — so long as they know where to look. And because the signal is empirical, the same pattern can be observed in historical data. This process facilitates the probabilistic distributions of the signal, much like tallying the number of hits over plate appearances goes into a baseball player’s batting average.
Broadly speaking, the quantitative approach draws on a range of mathematical principles, heavily influenced by Russian probabilistic theory—particularly Markov chains. Its foundation is further supported by GARCH (Generalized Autoregressive Conditional Heteroskedasticity) research, which shows that market volatility doesn’t disperse evenly over time but instead tends to cluster.
In other words, today’s volatility is largely shaped by yesterday’s—a reflection of how recent catalysts exert far more influence on market behavior than distant ones.
It’s really just common sense. If it’s cloudy today—especially in London—you’d grab an umbrella because past observations suggest rain is likely. That’s Bayesian reasoning in action. The only difference here is that we’re applying the same logic to MSFT stock—to turn that reasoning into tangible returns.
Extrapolating the Odds for MSFT Stock
As stated earlier, MSFT stock has an upward bias, so as an investor, it’s a pretty easy play to make — if all that you’re doing is hoping for any degree of profitability. However, under options trading, the profitability thresholds are defined both by magnitude and by time constraints. As such, an options strategy requires greater specificity.
Using pricing data going back to January 2019, the expected 10-week median returns of MSFT stock form a standard distribution or bell curve, with the bulk of prices ranging between $520 and $540 (assuming an anchor price of $513.58, Friday’s close).
From one perspective, bullish investors would be pleased to note that prices would be expected to cluster between $520 and $540 over the next 10 weeks as the most common statistical outcome. So long as the buy-in point is below the bottom of this range, there’s a good chance of profitability.
However, the difference between these two figures is roughly 4%. That can be quite consequential when deciphering a specific options trade. Interestingly, though, in the last 10 weeks through Friday, MSFT stock printed a 4-6-D sequence: four up weeks, six down weeks, with an overall downward trajectory.
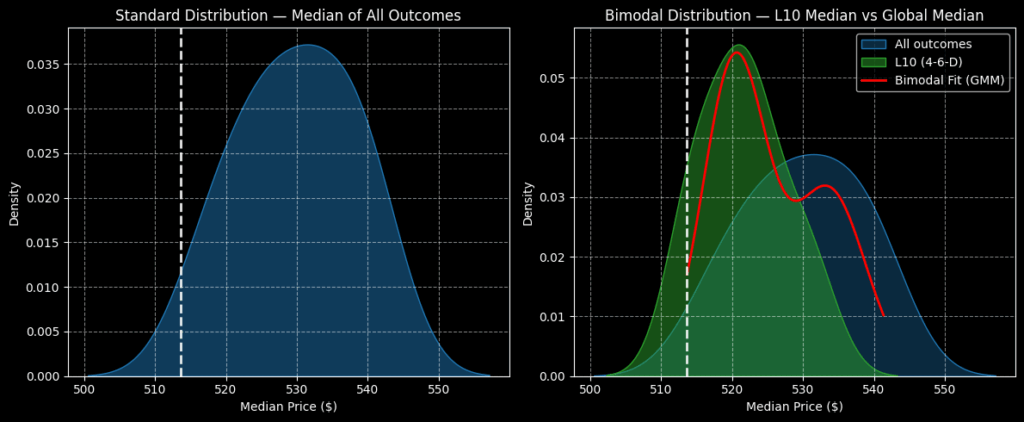
Statistically, under 4-6-D conditions, prices would be expected to cluster around $521. Overall, the bulk of prices would land below the median of all outcomes, which doesn’t sound favorable. However, in exchange for outright performance potential, the aforementioned quant signal indicates that MSFT stock will more reliably cluster around $521.
So, while this modest price target isn’t sexy, it helps you to prevent being overly ambitious without justifying evidence.
Given this dynamic, the most sensible idea may be the 515/520 bull call spread expiring November 21. This transaction involves buying the $515 call and simultaneously selling the $520 call, for a net debit of $275 (the maximum possible loss).

Should MSFT stock rise through the second-leg strike price — and price clustering data suggests that it can — at expiration, the maximum reward comes out to $225, a nearly 82% payout. The reward is relatively paltry and insignificant, although you’re statistically more likely to be successful at $520 than at other strike prices.
Is Microsoft a Buy, Sell, or Hold?
Turning to Wall Street, MSFT stock carries a Strong Buy consensus rating based on a unanimous Buy rating from all 32 analysts covering the stock. The average MSFT price target of $631.76 implies ~22% upside potential over the next 12 months.

Finding Statistical Advantage in Microsoft’s Steady Drift
As a trading vehicle, MSFT stock is compelling thanks to its consistent upward bias. That said, this steady drift comes with limited upside potential, and traditional methods offer little exploitable edge. A quantitative approach, however, can surface statistically reliable opportunities—smaller in payout, perhaps, but with a higher probability of success.