

Trading options is about narrowing down uncertainty — and very few enterprises are as uncertain as cryptocurrency miner and data center specialist CleanSpark (CLSK). Currently, if you look at TipRanks’ Expected Earnings Move, you’ll note that CLSK stock carries a projected dispersion of ~30% in either direction by the next earnings date of February 5, 2026.
Meet Samuel – Your Personal Investing Prophet
Explore CLSX for 2X leverage on CLSK
Ordinarily, that would be a massive spread for any other publicly traded security. For crypto-adjacent assets like CLSK stock, it’s just another Thursday. Of course, I’m being a bit hyperbolic here, but the main point is that CleanSpark can rip higher in the blink of an eye. For example, from mid-September to mid-October, the stock gained over 125%.
So, a 31% move following a strong earnings report wouldn’t be out of the question for the blockchain specialist. Nevertheless, you can’t just rely on past performances and intuition to successfully trade options with any regularity. You need a smarter approach to decipher the complexities of the derivatives market — and that’s exactly what we’re going to do here today.
Trading CleanSpark is Like Playing Detective
Most (if not all) options-based analyses hinge on implied volatility (IV), a residual measure denoting the kinetic profile of order flows affecting specific option chains. For example, the aforementioned Expected Earnings Move calculation is based in part on the IV associated with the options chain closest to the earnings disclosure date.
To use a simple analogy, IV is equivalent to the “whoosh” that a passing car makes relative to where you are standing. From the crack of the wind, you can infer how fast the vehicle is traveling at that moment in time. Further, you may reasonably assume that, if the driver was in that much of a hurry, then the urgency may be the same a few miles down the road.
However, you cannot infer with high confidence where the driver is going. Maybe the driver is late for work. Perhaps he’s looking for a thrilling ride. In a megalopolis such as Los Angeles, there could be a wide range of intentionality for this mystery driver.
Frankly, that’s what IV is telling us regarding CLSK stock. We have zero clue where the security will ultimately end up. We know that, based on all the available news, given all the macro events impacting cryptocurrencies and data centers, the option order flows indicate pronounced dispersion.
The common mistake occurs when individual analysts simply guess where the stock may go based on inferred strengths from past financial statements or previous developments. However, the problem is that all past data should be assumed to have been integrated into the stock price.
Instead, I argue that the proper approach is to narrow down possibilities based on established patterns. For example, in the “whoosh” analogy, if we know the time of day and the general direction the vehicle was heading toward, we may assign a higher probability to specific destinations and a lower probability to others.
Reframing CLSK Stock Under an Iterative Lens
While the idea of pattern recognition may be sensible, it’s also challenging to conceptualize because we experience CLSK stock as a singular journey across time. In a similar vein, we also experience our closest friends and family members as individual persons navigating time.
However, when describing our associations, we think in terms of patterns. For instance, if you’re in a relationship, you know what makes your partner tick. It’s not surprising to you because you have observed this behavior frequently. You also know what triggers these acute behaviors. By the same logic, public securities also exhibit behavioral tendencies under specific triggers.
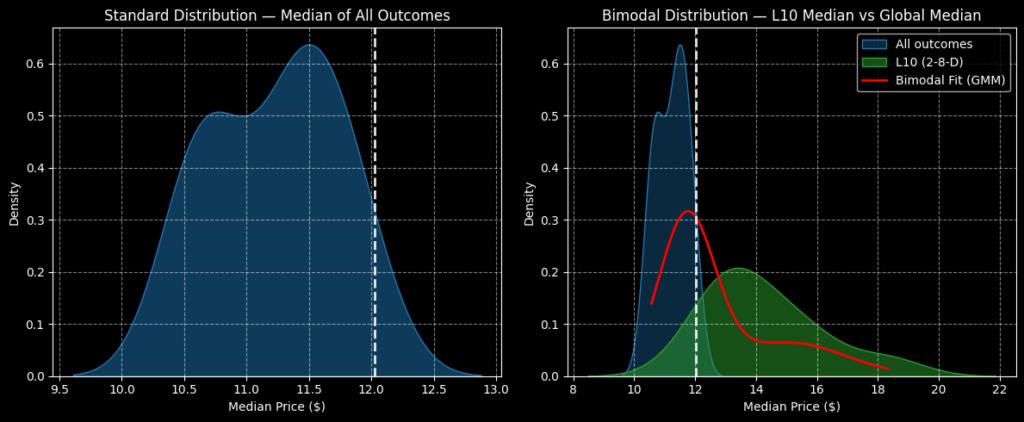
Finding this risk geometry requires a new framework, which is why I’m an adamant proponent of fixed-time distributional analysis. If we took a single 10-week strand of CLSK stock data, the return during this period wouldn’t tell us about the probability of performance for the other weeks in the dataset. However, if we stacked hundreds of rolling 10-week cycles in a distribution, the most consistent behaviors will yield a bulge in probability mass.
This bulge is “risk geometry” — and it’s quite frankly the one metric Wall Street doesn’t want you to see. Understanding risk geometry helps narrow the wide dispersion of outcomes, enabling you to focus on the most likely outcomes based on past patterns.
Regarding CLSK stock specifically, its 10-week distribution (using data from January 2019 onward) would likely range between $9.50 and $13 (assuming an anchor price of $12.03, Friday’s close). Price clustering would likely be predominant at $11.50, indicating a negative bias.
However, we’re interested in isolating the current quantitative signal, namely the 4-6-D sequence; that is, over the past 10 weeks, CLSK stock has printed only four up weeks, resulting in an overall downward slope. Under this setup, CLSK’s forward 10-week returns would likely range between $7.70 and $22.40, with price clustering likely to occur at around $13.50.

Still, with the earnings release coming up, I’m really tempted by the 13/15 bull call spread expiring on February 20, 2026. This capped-risk, capped-reward transaction requires CLSK stock to rise through the $15 strike at expiration to be fully profitable, which is an ambitious target. However, the maximum payout stands at over 217%.

Just as well, the breakeven price for the above trade is $13.63, which is near the peak of the probability density.
Is CLSK a Good Stock to Buy?
Turning to Wall Street, CLSK stock has a Strong Buy consensus rating based on 10 Buys, zero Holds, and zero Sell ratings. The average CLSK price target is $24.30, implying 87.5% upside potential in 2026.

Zeroing In on the Likely Destination of CLSK Stock
Given the highly kinetic nature of CleanSpark and its crypto-adjacent business, options traders expect significant movement for CLSK stock. Under traditional methodologies, it’s difficult to determine where the security may end up. However, using iteration under the framework of fixed-time distributional analysis, we can narrow down CLSK’s potential risk geometry.