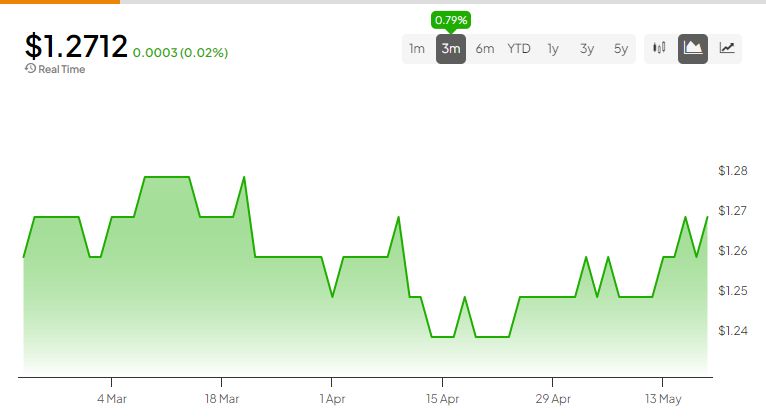
The GBP-USD pair is on a tear, trading near a two-month high around 1.2710. With the Federal Reserve’s potential rate cuts and UK inflation data looming, investors are keeping a close eye on key levels.
Claim 50% Off TipRanks Premium
- Unlock hedge fund-level data and powerful investing tools for smarter, sharper decisions
- Stay ahead of the market with the latest news and analysis and maximize your portfolio's potential

Technical Overview
The 100-day Simple Moving Average (SMA) at 1.2632 is the make-or-break level for GBP-USD. If the pair tests this level and holds, expect technical buyers to jump in. When it comes to targets, we’re looking at the 38.2% Fibonacci retracement at 1.2813, which is close to the psychologically important 1.2800.
But if GBP-USD closes below 1.2630, sellers could pile in, pushing the pair toward 1.2585 (50-day SMA) and 1.2541 (200-day SMA). Currently, the pair is above the 50-day, 100-day, and 200-day moving averages on the daily chart, which screams uptrend. The RSI has broken past the resistance line, adding to the bullish vibes.
Key Events to Watch
This week, all eyes are on the UK inflation data for April and the FOMC minutes. The UK’s Office for National Statistics is expected to show an annual headline CPI of 2.1% in April, down from 3.2%. Core CPI, which cuts out the volatile stuff like food and energy, is estimated to soften to 3.7% from 4.2%.
A drop in inflation could boost expectations for rate cuts by the Bank of England (BoE). Investors are betting that the BoE might start slashing rates as early as June. If that happens, it could weaken the Pound Sterling since lower rates typically reduce liquidity inflows, making the currency less attractive.
Investor Confidence and Economic Indicators
Investor confidence in Fed rate cuts has soared due to a drop in the US Consumer Price Index (CPI) and easing labor market conditions. Despite these indicators, Fed policymakers are still leaning towards keeping interest rates high. Fed Vice Chair for Supervision Michael Barr noted, “Q1 inflation was disappointing, did not provide the confidence needed to ease monetary policy.” The FOMC minutes, dropping on Wednesday, are expected to show that the Fed is all about keeping rates restrictive for longer.
Is GBP/USD A Buy?
According to TipRanks, the GBP-USD Moving Averages Convergence Divergence (MACD) indicator on a 1-week timeframe is 0.0008, suggesting a Buy. The 20-period EMA is 1.2588, while the price is 1.2702, also indicating a Buy. On a 1-month timeframe, the MACD is -0.0026, suggesting a Sell, while the 20-period exponential moving average at 1.2559 and the 50-period exponential moving average at 1.2781 provide mixed signals.


