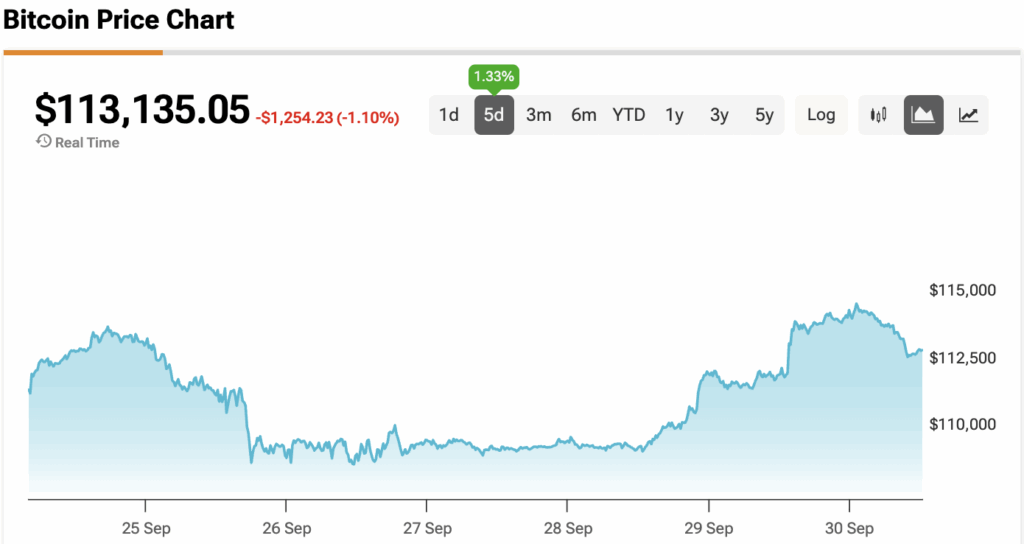
Bitcoin is showing signs that its recent sell-off may have already found a floor. After sliding to $108,650 last week, the largest cryptocurrency is now back above $113,000, with traders asking if the local bottom is finally in.
Claim 30% Off TipRanks
- Unlock hedge fund-level data and powerful investing tools for smarter, sharper decisions
- Discover top-performing stock ideas and upgrade to a portfolio of market leaders with Smart Investor Picks
Several on-chain and technical metrics suggest that the answer may be yes. From dormancy signals to capitulation indicators, analysts argue that Bitcoin could be setting up for a rebound that pushes it toward $118,000 in the short term, and possibly back to record highs if momentum continues.
Dormancy Flow Signals Bottom Territory
One of the most closely watched indicators is the entity-adjusted dormancy flow, which measures Bitcoin’s market capitalization relative to its annualized dormancy value. Historically, when this metric drops below 250,000 it has marked a strong buy zone.
Last Thursday, the metric fell as low as 133,300, its lowest in months. In past cycles, rebounds from these levels have coincided with the start of new bull runs, including the July 2021 bottom that preceded Bitcoin’s rally to $69,000.
With the dormancy flow once again in the “buy zone,” analysts say BTC could be preparing for another leg higher, with near-term targets at $118,000 and $124,500.
Short-term Holders Show Capitulation
Bitcoin’s short-term holder net unrealized profit/loss (NUPL) has also flipped negative, a sign that recent buyers are under pressure. Onchain data provider Glassnode noted that these capitulation periods often mark local bottoms, setting the stage for renewed accumulation.
“History says this capitulation zone often marks local bottoms,” said crypto analyst Jack, adding that the current setup “screams early accumulation.”
In previous cycles, negative NUPL readings have preceded sharp reversals as exhausted sellers exited and long-term holders or new entrants stepped in to absorb supply.
Bitcoin Chart Patterns Point to Recovery
Technicals are also lining up with the onchain signals. Bitcoin’s 12-hour chart is forming a V-shaped recovery, with the price bouncing sharply from $108,700 to above $113,000. The relative strength index (RSI) has risen from oversold levels at 27 to 53, hinting at building momentum.
Zooming out, Bitcoin is also forming a double-bottom pattern on the daily chart. If it clears the neckline resistance at $118,000, the move could open the way for a retest of the all-time high at $124,500, representing about 10% upside from current levels.
Analyst Matthew Hyland described the market structure as “just clean,” pointing to the double bottom and a potential breakout from an inverse head-and-shoulders setup. “Entering Q4 post-halving is when BTC has found cycle highs historically,” he noted.
Key Takeaway
Bitcoin’s bounce from $108,000 may prove to be more than just a relief rally. Analysts say dormancy signals, NUPL, and chart patterns are all lining up to suggest Bitcoin may have already found its bottom.
If BTC clears $118,000 in the days ahead, the case for a return to record highs above $124,500, and even a broader move toward $140,000, would gain significant momentum.
At the time of writing, Bitcoin is sitting at $113,135.