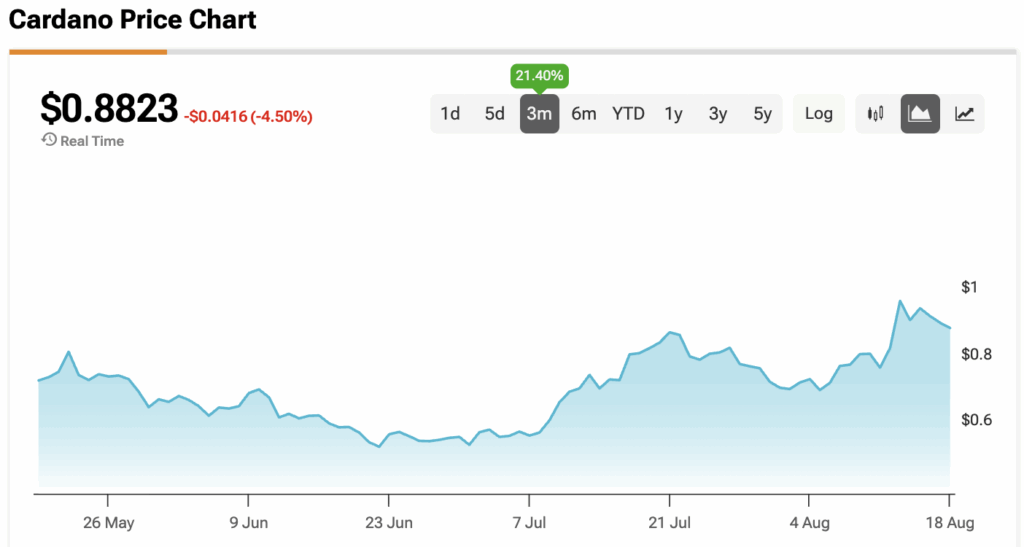
Cardano’s price (ADA-USD) has been climbing through August, up as much as 37% before pulling back. The big test now is whether ADA can break above $1, a level that has acted as strong resistance since December 2024.
Claim 55% Off TipRanks
- Unlock hedge fund-level data and powerful investing tools for smarter, sharper decisions
- Discover top-performing stock ideas and upgrade to a portfolio of market leaders with Smart Investor Picks
$1 is what traders call a psychological level, meaning many buyers and sellers pay close attention to it. If the price closes firmly above $1 and then holds that level as new support, it could unlock much higher targets.
Analysts Spot Bull Flag Pattern in Cardano’s Chart
According to analyst Clifton Fx, ADA has been trading inside what is called a bull flag pattern since December. A bull flag is a chart shape that often appears after a strong rally. It usually means the market is taking a short pause before moving higher again.
Clifton said in a post on X that the pattern has already confirmed an upside breakout on the three-day chart. He added: “Now expecting a massive 100% – 150% bullish rally in the coming weeks.” The technical target from this pattern is about $1.80. On shorter time frames, the target is a bit lower at $1.27, but both show momentum is building.
Triangle Pattern Points Toward a $2 ADA
Another bullish setup is visible on the weekly chart. ADA has broken out of a symmetrical triangle, another technical pattern that suggests a continuation of an upward trend. If the price can close a weekly candle above the $1 level, the technical target becomes $2.12.
That would mean gains of about 140% from current levels. Supporting this view, the relative strength index (RSI), which measures momentum, has climbed from 41 in June to 59 now. This shows demand for ADA is steadily increasing on higher time frames.
Cardano’s Futures Market Volume Surges
Activity in the futures market adds fuel to the bullish case. ADA futures volume has jumped to $7 billion, its highest level in five months, according to data from Glassnode. Futures are contracts that allow traders to speculate on price moves without owning the asset, and higher volume usually signals greater market interest and liquidity.
From April until recently, ADA futures volume stayed between $1 billion and $4 billion. The sudden jump to $7 billion suggests both retail and institutional investors are piling in. The last time volumes were this high, ADA was trading above $1.
ADA ETF Odds and DeFi Growth Strengthen Case
Another driver is the rising chance of a spot Cardano ETF. According to Polymarket, approval odds climbed to 81% on Tuesday, up from 59% at the start of August. ETFs make it easier for large investors to gain exposure to ADA, which could drive more demand.
At the same time, Cardano’s total value locked (TVL) in DeFi protocols has surged 56% since July 1, reaching $423.6 million. TVL measures how much money is tied up in smart contracts on the blockchain. Historically, increases in TVL have lined up with strong ADA rallies. For example, when TVL jumped 271% after the 2024 elections, ADA prices soared 300% in the same period.
What To Watch Next
The next few weeks hinge on whether ADA can break and hold above the $1 resistance. If it does, traders see a clear path toward $1.80 to $2.12. If it fails, the price could remain stuck below $1 until buyers build more strength.
At the time of writing, ADA is sitting at $0.8823.