The Invesco QQQ Trust (QQQ) ETF, which tracks the Nasdaq-100 index (NDX), has gained about 31% year-to-date, compared to the 9.8% gain in the S&P 500 Index (SPX). At the same time, the Vanguard Information Technology ETF (VGT), a technology sector-specific ETF, has generated similar returns. While both of these ETFs have outperformed the broader markets, let’s zoom in on these ETFs to find which is a better buy.
Confident Investing Starts Here:
- Easily unpack a company's performance with TipRanks' new KPI Data for smart investment decisions
- Receive undervalued, market resilient stocks right to your inbox with TipRanks' Smart Value Newsletter
The rebound in the shares of technology companies has led tech-focused ETFs (Exchange-Traded funds) to deliver market-beating returns in 2023. To compare these two ETFs, let’s begin with their top 10 holdings.
QQQ and VGT Top Holdings
The top 10 holdings of VGT show that it is a tech-sector-specific ETF and includes companies that serve the electronics and computer industries. Moreover, its top 10 holdings account for about 64% of its total net assets.
As for QQQ stock, its top 10 holdings account for 58.6% of its total net assets. While the ETF is primarily tech-heavy, it also gives exposure to consumer, streaming service, and healthcare stocks.

VGT vs. QQQ: Performance
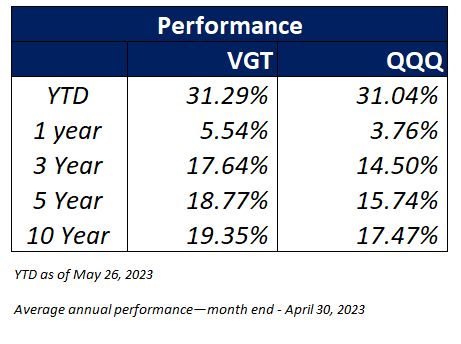
As technology stocks have outperformed other sectors in the past decade, the VGT ETF, purely focused on tech companies, has consistently generated higher returns than the QQQ ETF (refer to the image below), which has exposure to other sectors.

What’s the Prediction for VGT and QQQ ETFs?
The QQQ ETF has an Outperform Smart Score of eight. Meanwhile, the QQQ ETF has a Moderate Buy consensus rating on TipRanks. Among the 1,719 analysts providing ratings on its holdings, 66.96% have a Buy rating, 29.20% have a Hold, and 33.84% recommend Sell. The 12-month average QQQ ETF price target of $375.77 implies 7.85% upside potential.
As for VGT, the ETF also sports an Outperform Smart Score of eight. The VGT ETF has a Moderate Buy consensus rating on TipRanks. Per the recommendations of 3,154 analysts giving stock forecasts for the holdings of VGT, the 12-month average price target of $446.28 implies 6.63% upside potential from current levels.
Among the analysts providing ratings on its holdings, 62.94% have given a Buy rating, 32.69% have assigned a Hold rating, and 4.38% have given a Sell rating.
Bottom Line
VGT has edged past QQQ with its returns. Moreover, it has a lower expense ratio of 0.10% compared to QQQ’s 0.20%.
However, both of these ETFs carry a Moderate Buy consensus rating on TipRanks and have an Outperform Smart Score. Thus, both ETFs look like attractive long-term bets. However, investors seeking exposure to high-growth and high-risk tech stocks could consider investing in VGT. Meanwhile, investors looking to invest in tech stocks and seek diversification in other sectors could choose the QQQ ETF.
Looking for a trading platform? Check out TipRanks' Best Online Brokers guide, and find the ideal broker for your trades.
Report an Issue


