The Fidelity MSCI Information Technology Index ETF (NYSEARCA:FTEC) has returned over 40% year to date as tech stocks have raced to large gains in 2023. There’s a lot to like about this $7.4 billion ETF from asset management giant Fidelity beyond this 2023 surge, including its low fees and long-term track record of strong performance.
Claim 70% Off TipRanks Premium
- Unlock hedge fund-level data and powerful investing tools for smarter, sharper decisions
- Stay ahead of the market with the latest news and analysis and maximize your portfolio's potential
What is FTEC?
As you might guess from the ticker, FTEC is asset management giant Fidelity’s tech-focused ETF. The fund’s goal is to “provide investment returns that correspond, before fees and expenses, generally to the performance of the MSCI USA IMI Information Technology Index.” The fund invests at least 80% of its assets in this index, which as you’ll see below, is comprised of stocks representing different facets of the technology sector, ranging from software to semiconductors. Since its inception in 2013, the fund has grown to $7.5 billion in assets under management (AUM). FTEC pays a dividend, although the current yield is just 0.7%.
Top Holdings
Is FTEC diversified? Yes and no. On the one hand, it holds 309 stocks, which would count as ample diversification in most people’s books. On the other hand, it is fairly concentrated as its top 10 holdings account for over 60% of assets, leaving investors with a lot of exposure to a handful of stocks. Below, you can take a look at this dynamic using TipRanks’ holdings tool.
The concentration goes even further than that statistic indicates, as FTEC’s top two holdings, Apple and Microsoft combine to make up well over 40% of the fund, which is a pretty staggering number. These stocks have been top performers of late, so it has benefitted FTEC and its holders, but it is something for investors to keep an eye on as the fund could take a hit if one or both of these stocks hit a rough patch in the future.
Beyond Apple and Microsoft, FTEC’s top ten holdings include many of the high-profile tech names that have led the market higher this year, including semiconductor names like Nvidia, Broadcom and Advanced Micro Devices, as well as software giants like Oracle, Adobe, and Salesforce.
FTEC’s top holdings collectively have great Smart Scores, with seven of the ten scoring an 8 or above, led by Nvidia and Salesforce which boast perfect 10 out of 10 ratings.
The Smart Score is a proprietary quantitative stock scoring system created by TipRanks. It gives stocks a score from 1 to 10 based on eight market key factors. The score is data-driven and does not involve any human intervention. Six of the eight market factors which are incorporated into the Smart Score calculation are unique to TipRanks, only the technicals and fundamentals are not A Smart Score of 8 or higher is equivalent to an Outperform rating. FTEC itself has an Outperform-equivalent ETF Smart Score of 8 out of 10.

Long-term Performance
With the tech sector surging, FTEC has racked up a monster total return of over 40% year to date, just over halfway into 2023. But it has been a strong performer for a long time.
As of the quarter that ended in June, FTEC had an impressive three-year total annualized return of 18%. Going further out, FTEC’s five-year annualized return of 20% is even more exceptional. The fund launched in August 2013, so it does not yet officially have a ten-year return, but since its inception (which is very close to ten years ago), it has returned a stellar 19.9% on an annualized basis.
In fact, FTEC has soundly beaten the broader market over time. Using the Vangaurd S&P 500 ETF (NYSEARCA:VOO) as a proxy for the S&P 500, FTEC’s three- and five-year returns of 18.0% and 20.0% have beaten VOO’s solid returns of 14.6% and 12.3% over the same time frames.
Meanwhile, if you want to instead compare FTEC’s performance to that of a top tech-oriented fund like the aforementioned QQQ, FTEC’s 18.0% and 20.0% three- and five-year returns compare favorably with QQQ’s still excellent three- and five-year annualized returns of 15.0% and 17.4% as well.
As you can see, no matter which way you slice it, it’s safe to say that FTEC has compiled an outstanding track record and beaten the market over time.
Low Cost
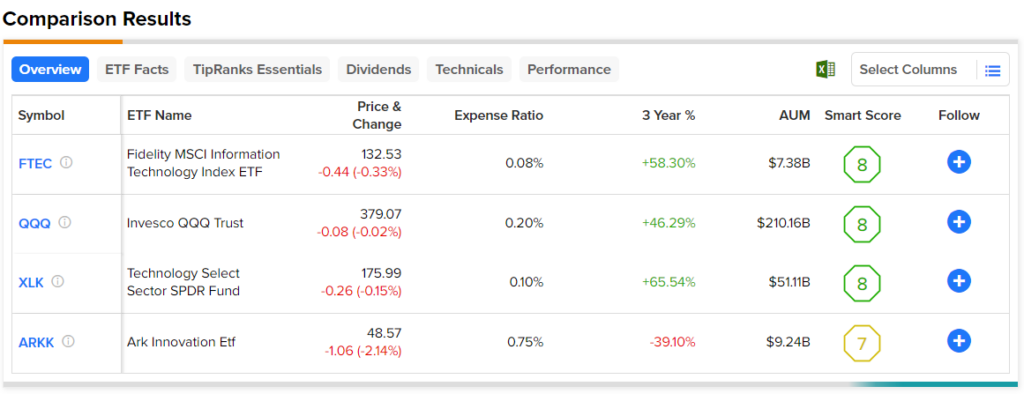
One major benefit of investing in FTEC is its low fees. The fund’s expense ratio is just 0.084%. This means that investors putting $10,000 into the fund will pay just a very reasonable $8.40 in expenses in year one. Over the course of a ten-year investment, assuming the fees stay constant and the fund returns 5% per annum, the same FTEC investor would pay just $108 in fees over the course of the decade. This expense ratio is even cheaper than the reasonable fees offered by some of the largest tech-focused ETFs that are known for their low costs, like QQQ and XLK, which charge 0.10% and 0.20%. And it’s far cheaper than those of other popular tech ETFs like Ark Innovation, which charges 0.75%. For this reason, FTEC deserves top marks for cost.
Below, you can take a look at how FTEC compares to these peers based on fees and a variety of other factors using TipRanks’ ETF Comparison Tool, which enables investors to compare up to 20 ETFs at once across a spectrum of customizable data points.

Investor Takeaway
FTEC’s one cause for concern is its heavy allocation towards just two stocks, Microsoft and Apple, although this hasn’t been much of a concern over the past year. Aside from that, there is a lot to like about FTEC. Its stellar performance track record has seen it outperform both the broader market and the more widely-known QQQ over time, and it has a strong portfolio, favorable expense ratio and Outperform-equivalent Smart Score. These factors all make FTEC a great option for investors looking for tech exposure, and a viable alternative to the more widely-known QQQ, which is another great tech ETF in its own right.


