The Schwab U.S. Dividend Equity ETF (NYSEARCA:SCHD) and the Invesco S&P 500 High Dividend Low Volatility ETF (NYSEARCA:SPHD) are two popular dividend ETFs from leading asset managers. With a dividend yield of 4.5%, SPHD’s yield is higher than SCHD’s dividend yield of 3.5%. But which one is the better overall ETF for investors? Let’s find out.
Claim 50% Off TipRanks Premium
- Unlock hedge fund-level data and powerful investing tools for smarter, sharper decisions
- Stay ahead of the market with the latest news and analysis and maximize your portfolio's potential
What are the SCHD and SPHD ETFs’ Strategies?
According to fund sponsor Charles Schwab (NYSE:SCHW), SCHD’s “goal is to track as closely as possible, before fees and expenses, the total return of the Dow Jones U.S. Dividend 100 Index,” an index that is “focused on the quality and sustainability of dividends.”
SCHD launched in 2011 and has grown to $52.0 billion in assets under management (AUM).
Meanwhile, according to Invesco (NYSE:IVZ), SPHD invests in the “S&P 500 Low Volatility High Dividend Index,” an index “composed of 50 securities traded on the S&P 500 Index that historically have provided high dividend yields and low volatility.”
SPHD started in 2012 and has accumulated $3.0 billion in AUM since that time.
Comparing the Two Portfolios
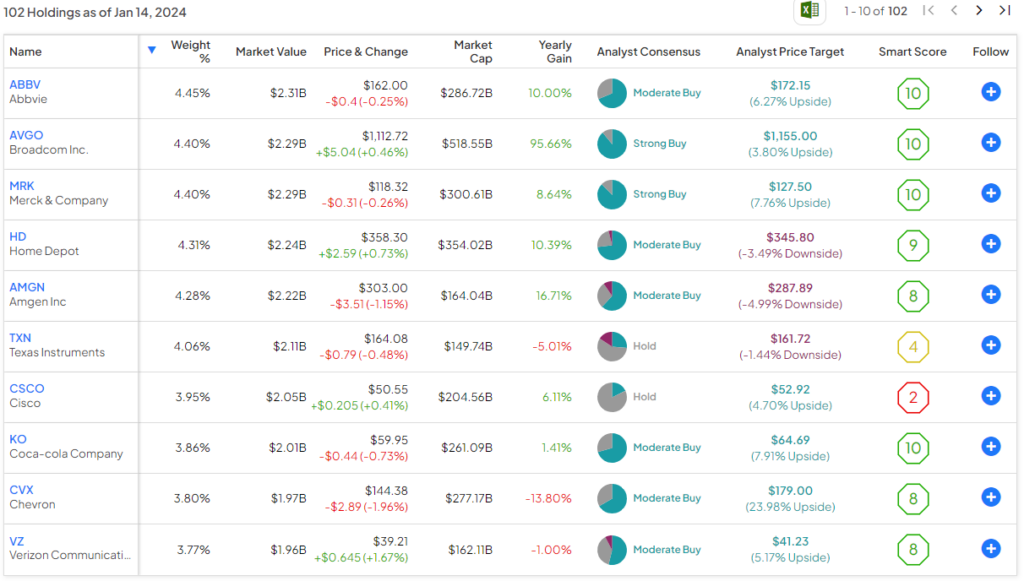
SCHD invests in 102 stocks, and its top 10 holdings make up 41.3% of the fund. Below is an overview of SCHD’s top 10 holdings.
Meanwhile, SPHD holds 51 stocks, and its top 10 holdings make up 28.3% of the fund. Below is an overview of SPHD’s top 10 holdings.
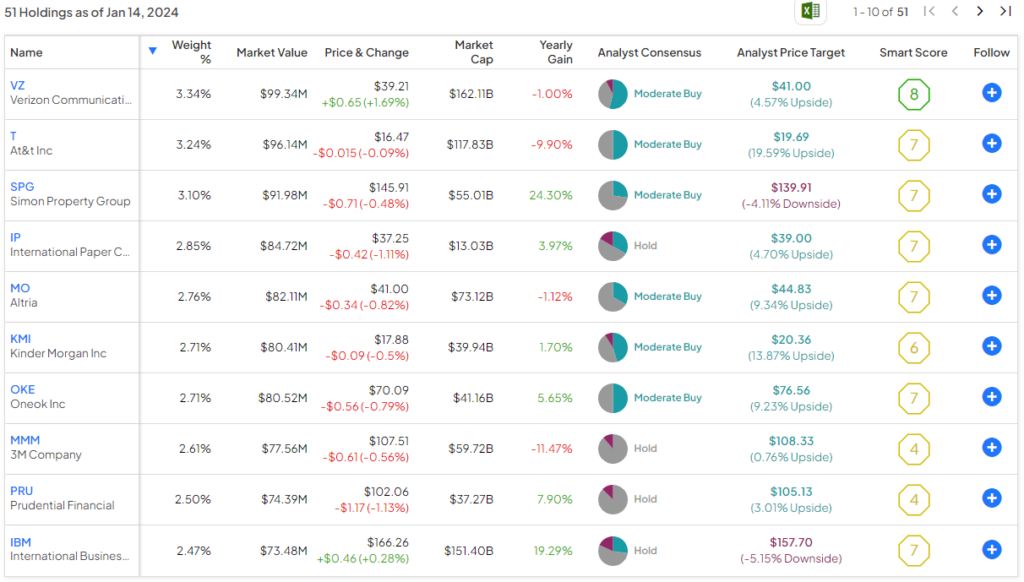
While SCHD holds more positions, SPHD is less concentrated in its top 10 positions, so both funds offer decent diversification in their own way. The different approaches that these two dividend funds take are apparent when viewing their top holdings.
SCHD is more geared towards dividend stocks that offer a mix of growth and dividend payouts, as illustrated by holdings like Broadcom (NYSE:AVGO) and Home Depot (NYSE:HD).
While these stocks don’t necessarily feature the highest dividend yields (Broadcom sports a dividend yield of 1.7% while Home Depot yields 2.4%), they have generated substantial total returns over the years, thanks to a combination of dividend payouts and share price growth. For example, Broadcom has posted an incredible total return of 2,629% over the past 10 years, while Home Depot has returned an impressive 453.3% over the past decade.
On the other hand, SPHD skews more towards stocks with higher dividend yields but lower growth prospects, including telecoms like its top holding Verizon (NYSE:VZ), its second-largest holding AT&T (NYSE:T), and a handful of real estate investment trusts (REITs) such as Simon Property Group (NYSE:SPG). Verizon, AT&T, and Simon Property Group offer high dividend yields of 6.8%, 6.7%, and 5.1%, respectively.
TipRanks’ Smart Score system currently gives both ETFs the same rating. The Smart Score is a proprietary quantitative stock scoring system created by TipRanks. It gives stocks a score from 1 to 10 based on eight market key factors. A score of 8 or above is equivalent to an Outperform rating.
While eight of SCHD’s top 10 holdings feature Outperform-equivalent Smart Scores of 8 or higher, only one of SPHD’s top holdings does, with the rest featuring Neutral-equivalent ratings. Nonetheless, based on their overall holdings, both ETFs feature Neutral-equivalent Smart Score ratings of 7 out of 10.
These ETFs employ sound strategies, but one of the ETF’s strategies has resulted in demonstrably stronger returns over time, as we’ll delve into below.
Head-to-Head Performance Comparison
SCHD’s portfolio that focuses on stocks that offer a mix of growth and dividend yield, like Broadcom and Home Depot, has generated superior returns to SPHD’s portfolio over time. As of December 31, SCHD has generated an annualized three-year total return of 9.5% versus a return of 8.7% for SPHD over the same time frame.
This isn’t a huge difference, but SCHD’s lead becomes more pronounced over a longer time frame. Over the past five years (as of December 31), SCHD’s annualized return of 14.0% is double SPHD’s annualized total return of 7.0%.
Lastly, over a 10-year time frame, SCHD’s annualized total return of 11.0% (again, as of December 31) trumps SPHD’s annualized total return of 8.7%.
Disparity in Fees
While SCHD has provided investors with superior returns than SPHD, it is also the cheaper of the two funds by a tangible margin. SCHD features an ultra-low expense ratio of just 0.06%. SPHD’s 0.30% expense ratio is reasonable overall, but it is significantly higher than SCHD’s in this comparison.
An investor allocating $10,000 to SCHD would pay $6 in fees annually, while an investor putting the same amount into SPHD would pay $30 in fees.
Assuming that the funds both return 5% per year going forward and maintain their current expense ratios, the SCHD investor mentioned above would pay $77 in fees over 10 years, while the SPHD would pay $381 in fees over the same time frame.
Is SCHD Stock a Buy, According to Analysts?
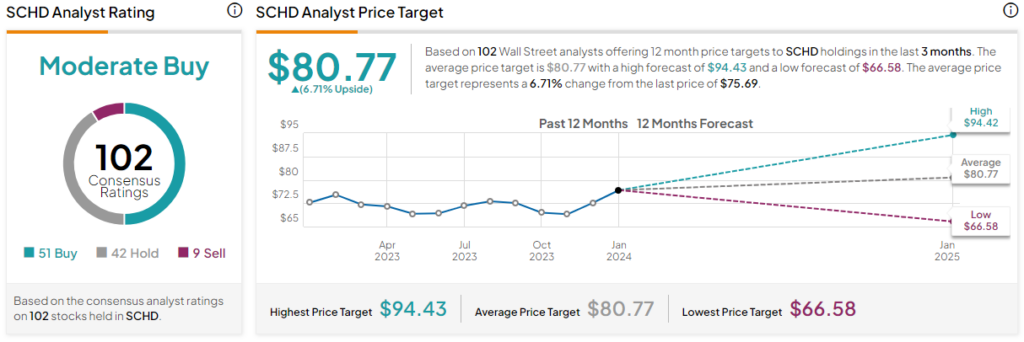
Turning to Wall Street, SCHD earns a Moderate Buy consensus rating based on 51 Buys, 42 Holds, and nine Sell ratings assigned in the past three months. The average SCHD stock price target of $80.77 implies 6.7% upside potential.
Is SPHD Stock a Buy, According to Analysts?
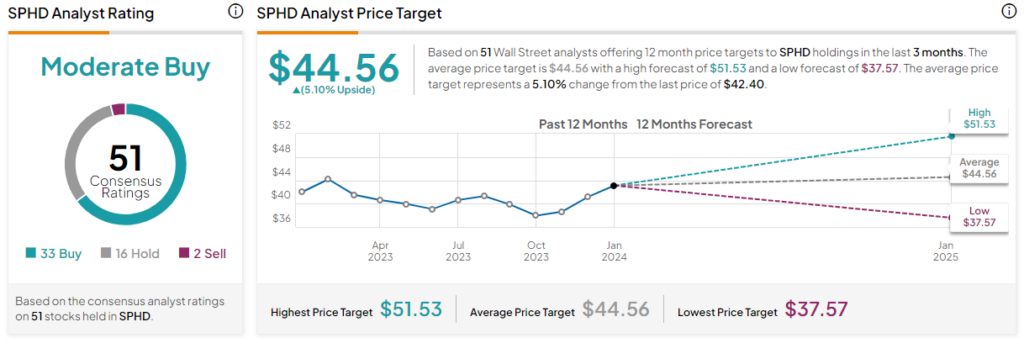
SPHD also earns a Moderate Buy consensus rating based on 33 Buys, 16 Holds, and two Sell ratings assigned in the past three months. The average SPHD stock price target of $44.56 implies 5.1% upside potential.
Investor Takeaway
These are both solid dividend funds that have produced positive returns for investors over the long run, but there is a clear winner here. SPHD features a higher dividend yield than SCHD, but over time, SCHD has delivered superior total returns for a significantly lower price, making it the superior choice for investors.
After taking a closer look at both funds, It’s clear that SCHD’s portfolio of stocks that offer a combination of dividend payments and growth has generated better returns than SPHD’s portfolio, which is more skewed towards higher-yielding but lower-growth stocks like AT&T, Verizon, and Simon Property Group. As such, I’m bullish on SCHD and view it as the better choice, going forward.


