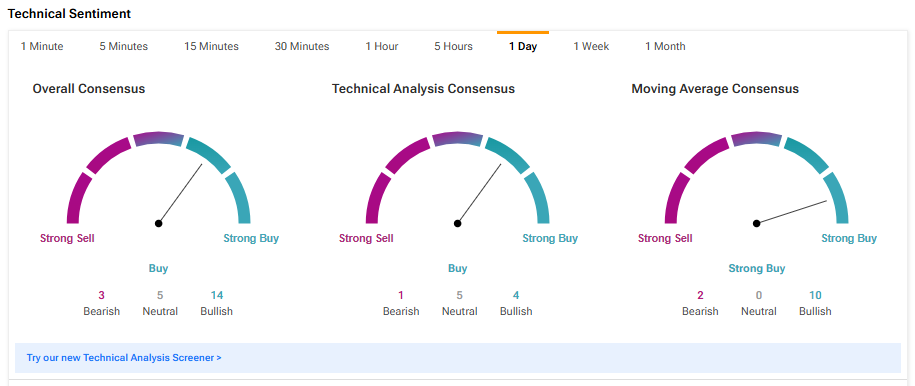
With a market cap of $2.80 trillion, tech giant Apple (AAPL) is the second largest company in the U.S. The company’s diverse technology products, strong focus on product innovation, and customer loyalty keep AAPL well-poised to maintain its position as a market leader. Importantly, AAPL stock has gained more than 23% over the past year. Despite its impressive gains, technical indicators suggest that Apple stock is a Buy, implying further upside from current levels.
Claim 70% Off TipRanks This Holiday Season
- Unlock hedge fund-level data and powerful investing tools for smarter, sharper decisions
- Stay ahead of the market with the latest news and analysis and maximize your portfolio's potential

Analyzing AAPL’s Technical Indicators
According to TipRanks’ easy-to-understand technical analysis tool, AAPL stock is currently on an upward trend. The Moving Averages Convergence Divergence (MACD) indicator, a crucial tool for understanding momentum and potential price direction shifts, is currently signaling a Buy.
AMZN’s 50-day EMA (exponential moving average) is 226.22, while its price is $226.96, implying a bullish signal.
Another technical indicator, Williams %R, helps traders determine if a stock is overbought or oversold. In the case of Apple, the Williams %R is currently indicating a buy signal, suggesting that the stock is not overbought and has more room to run.
What Is the Price Target for AAPL?
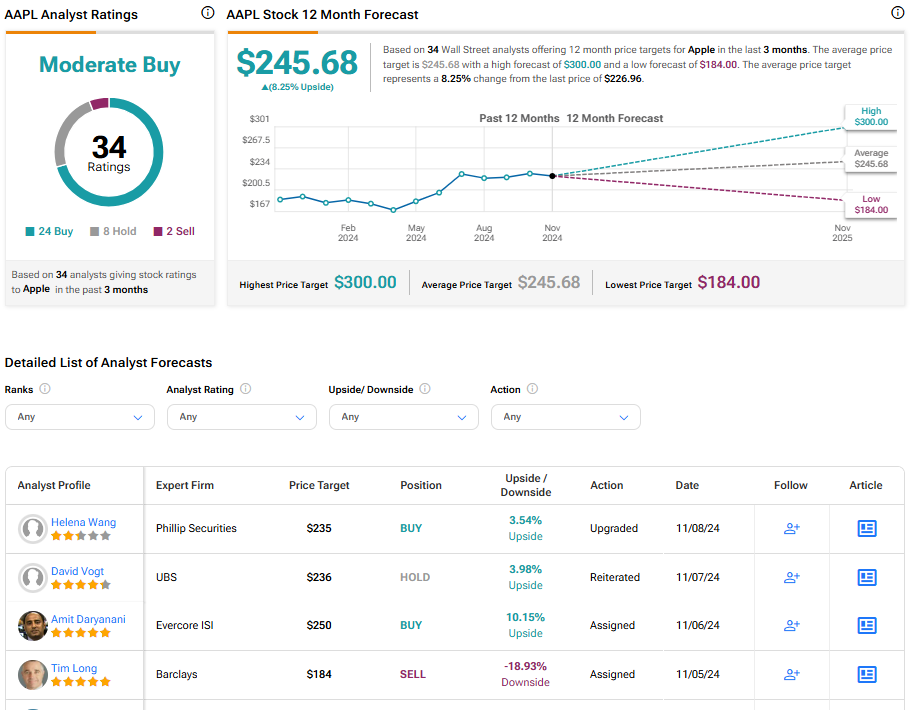
Turning to Wall Street, AAPL has a Moderate Buy consensus rating based on 24 Buys, eight Holds, and two Sells assigned in the last three months. At $245.68, the average Apple price target implies an 8.25% upside potential.


