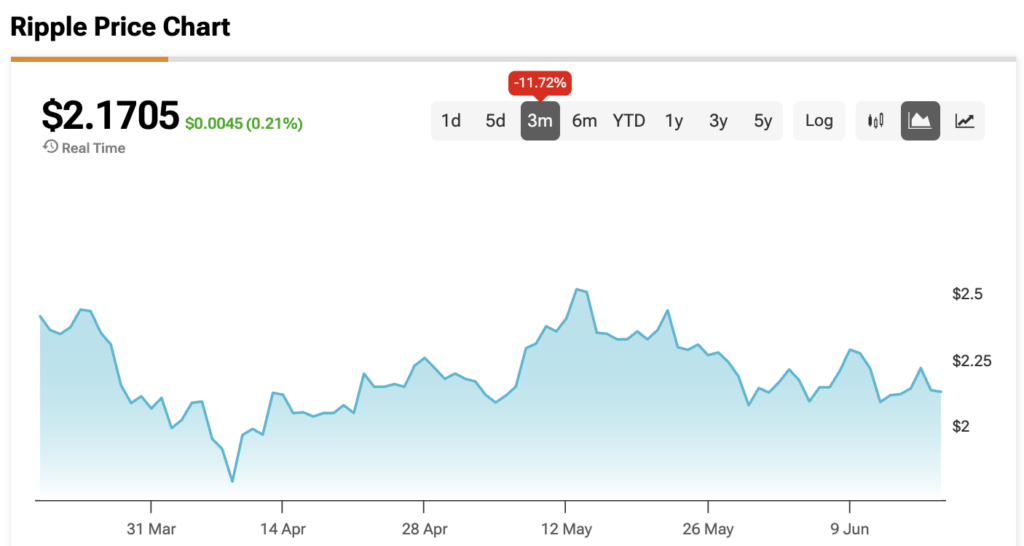
XRP (XRP-USD) has been stuck in neutral, consolidating in a tight range between $2.05 and $2.33 for over a month. Bulls have tried and failed to break higher, and the $3 mark remains frustratingly out of reach. Now the on-chain data is painting a clear picture, and it’s not bullish. Weak network activity, collapsing open interest, and technical resistance are all stacking up. And some analysts say the next move could be down, not up.
Claim 30% Off TipRanks
- Unlock hedge fund-level data and powerful investing tools for smarter, sharper decisions
- Discover top-performing stock ideas and upgrade to a portfolio of market leaders with Smart Investor Picks
XRP’s Network Activity Drops Off A Cliff
The XRP Ledger is flashing warning signs. On-chain data shows network engagement has cratered since the start of the year. New daily addresses have dropped from a January peak of 15,823 to just 3,500 as of Thursday, according to Glassnode.
Daily active addresses (DAAs) are also in free fall, plunging from 577,000 to just 34,360 over the past week. That’s not just a cooling-off. That’s a major loss of momentum.
Analysts say that kind of drop reflects more than apathy, it signals retreat. Less activity means fewer transactions, lower liquidity, and weaker price action.
XRP’s Open Interest Nosedives as Traders Step Back
The weakness is backed up in the derivatives data. Open interest on XRP has fallen 30% in just a month, from $5.53 billion to $3.89 billion. That’s a $1.6 billion evaporation in speculative capital.
When open interest collapses, it usually means traders are closing positions or pulling capital from the market entirely. And history shows that big OI drops often lead to price declines, just like they did before XRP plunged 53% earlier this year.
Right now, traders aren’t betting on a breakout. They’re stepping away.
XRP’s Price Is Still Trapped Below Major Moving Averages
The technicals aren’t offering much hope either. XRP remains pinned under key resistance between $2.22 and $2.40 — exactly where all the major simple moving averages (SMAs) are clustered.
Until XRP can break through that wall, it’s stuck in consolidation. And if recent history holds, that could drag on for weeks. Last time XRP lost these trendlines, it traded sideways for up to 65 days before finally breaking lower.
Bearish Patterns Suggest $1.20 XRP May Be Back In Play
Analysts like CasiTrades say the longer XRP sits below $2.25, the more likely a sweep of lower support levels becomes. “$2.01, $1.90, even $1.55 are still on the table,” they posted on Wednesday.
The chart is also starting to print a descending triangle, a classic bearish pattern that often breaks to the downside. If it does, XRP could fall 45% to around $1.20. That would take it back to levels last seen in early 2024.
The RSI has also cooled off, dropping from an overheated 81 in January to just 51 now — a sign of fading bullish strength.
XRP Needs a Big Catalyst
The longer XRP stays stuck, the more fragile it becomes. On-chain data is shrinking. Traders are backing off. Key resistance remains unbroken. Until the bulls come back with volume and conviction, $3 isn’t just unlikely, it’s out of reach. And if support breaks, XRP may have to revisit $1.20 before it gets another shot at higher levels.
At the time of writing, XRP is sitting at $2.17.